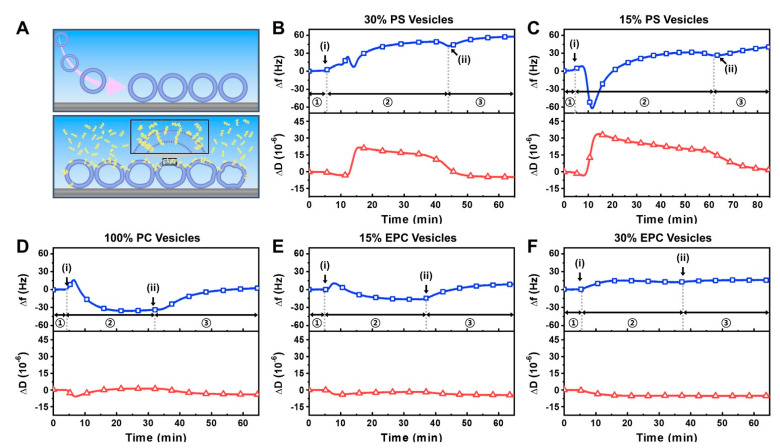
Figure 3.
QCM-D tracking of LTX-315 peptide interactions with intact vesicle adlayer depending on membrane surface charge: (A) schematic illustration of intact vesicle adlayer on TiO2-coated sensor surface before and after peptide addition; (B–F) corresponding QCM-D measurement kinetics for peptide addition to (B) 70/30 DOPC/DOPS, (C) 85/15 DOPC/DOPS, (D) 100 DOPC, (E) 85/15 DOPC/DOEPC; and (F) 70/30 DOPC/DOEPC lipid vesicle adlayers. In each panel, the QCM-D Δf (top, blue squares) and ΔD (bottom, red triangles) shifts are presented as a function of time and the initial baseline signals correspond to the intact vesicle adlayer. Stages 1, 2, and 3 correspond to intact vesicle platform alone, during peptide addition, and during buffer washing, respectively. Arrows i and ii denote peptide addition and buffer washing steps, respectively.

