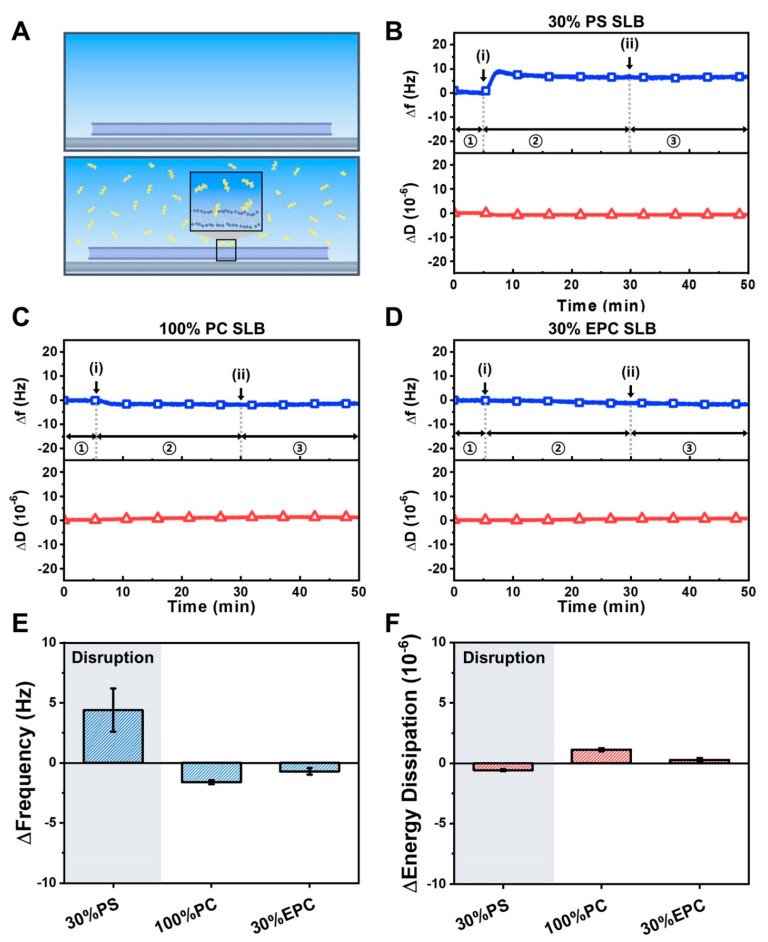
Figure 5.
QCM-D tracking of LTX-315 peptide interactions with supported lipid bilayers depending on membrane surface charge: (A) schematic illustration of supported lipid bilayer on SiO2-coated sensor surface before and after peptide addition; (B–D) corresponding QCM-D measurement kinetics for peptide addition to (B) 70/30 DOPC/DOPS, (C) 100 DOPC, and (D) 70/30 DOPC/DOEPC supported lipid bilayers. In each panel, the QCM-D Δf (top, blue squares) and ΔD (bottom, red triangles) shifts are presented as a function of time and the initial baseline signals correspond to the supported lipid bilayer platform. Arrows i and ii denote peptide addition and buffer washing steps, respectively; (E,F) summary of QCM-D measurement responses for LTX-315 peptide interactions with supported lipid bilayers. In panels (B–D), stages 1, 2, and 3 correspond to supported lipid bilayer platform alone, during peptide addition, and during buffer washing, respectively. Maximum responses of the (E) Δf and (F) ΔD shifts are presented based on the data in panels (B–D) and are reported as the mean ± standard deviation from n = 3 measurements.

