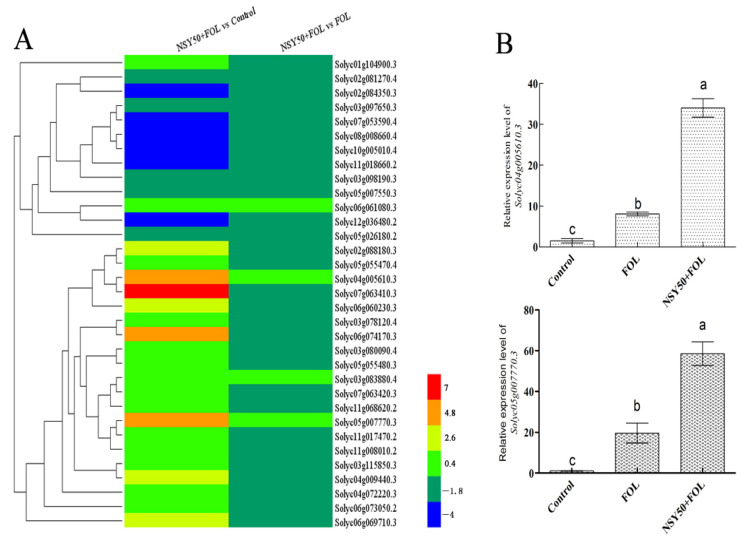
Figure 4.
SlNAP1 and SlNAP2 were strongly induced by Fol. (A) Heatmap of 33 differentially expressed NAC transcription factors; (B) relative expression levels of SlNAP1 and SlNAP2 under different treatments. Different letters (a, b, and c) indicate statistically significant differences at p = 0.05 level.

