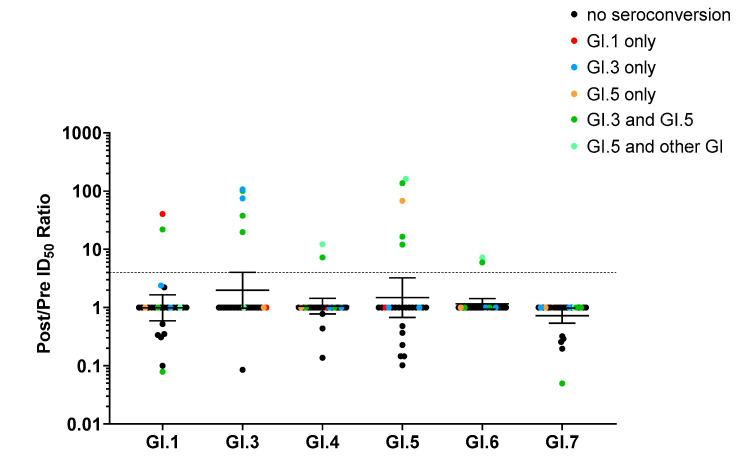
Figure 4.
Patterns of blockade antibody seroconversion following infection with genogroup I human noroviruses. Univariate scatter plot of the fold increase in blockade antibody response between pre- and post-genogroup I norovirus infections; color-coded by the seroconverted genotypes with a ≥4-fold increase: none (•), GI.1 (•), GI.3 (•), GI.5 (•orange), GI.3 and GI.5 (•), and GI.5 plus any other genogroup I genotype (•) (n = 26). Marker: one child. Line and error bars: geometric mean and 95% confidence intervals. Dashed line: 4-fold increase.

