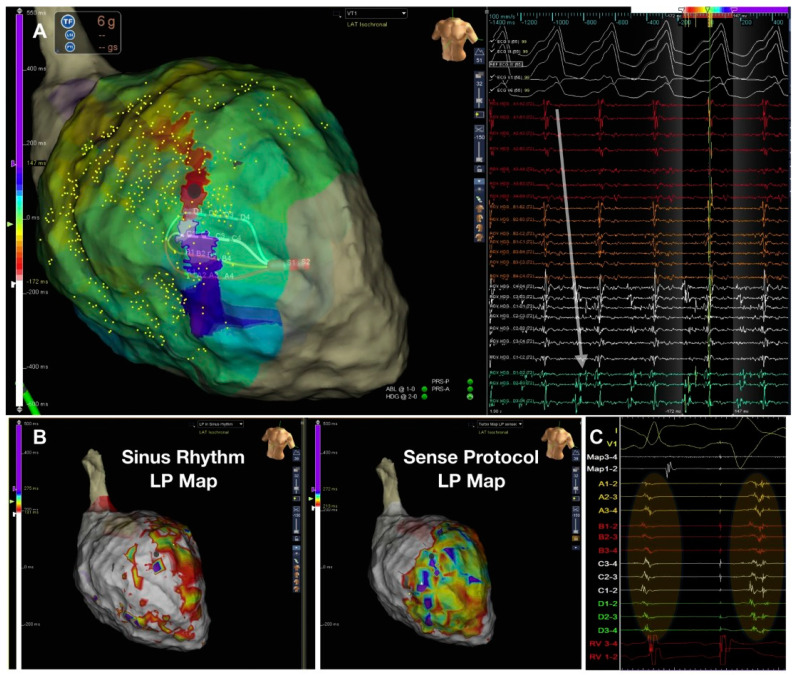
Figure 3.
Figure adapted from Srinivasan et al. [35] illustrating the Barts’ sensed protocol. (A) shows a high-density VT activation map. (B) illustrates the 2 activation maps during sinus rhythm (left) with a late potential (LP) color timing map and the activation time during the sensed RV pacing beat ((B) right) showing a greater region of LPs during Bart-sense-protocol colocalizing to a greater extent with the mapped isthmus of the induced VT (A). (C) shows delay and splitting of LPs during sense protocol (second beat) is observed within the region of the diastolic pathway of VT.

