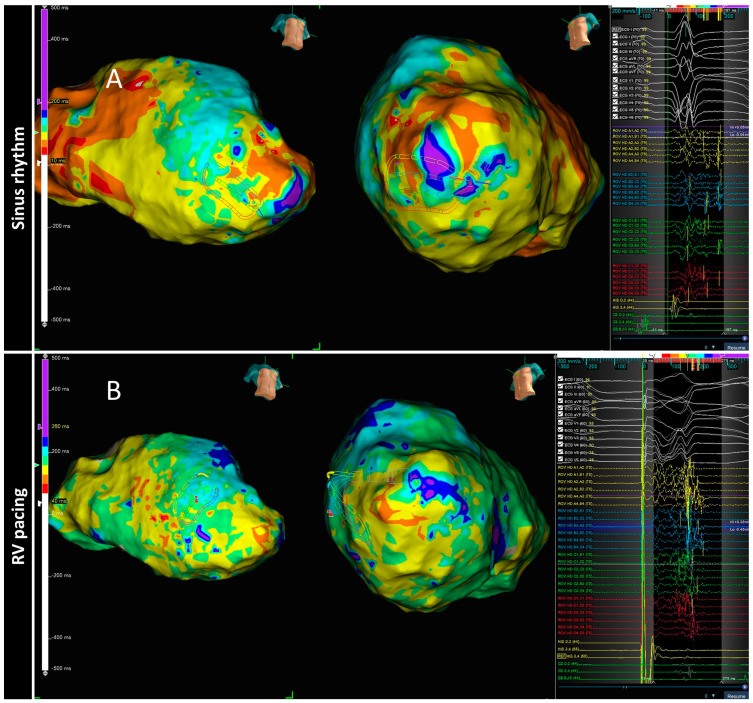
Figure 4.
The spatial distribution of activation slowing is influenced by the direction of left ventricular activation. An example of two different maps performed in the same patient during two different ventricular activations: spontaneous sinus rhythm (A) and RV pacing (B). The general zone of activation slowing was similar between maps, similar to the signals shown on the right side of the panels obtained at each HD grid catheter location depicted, consequently, this area should be ablated according to the PHISIO-VT study [38].

