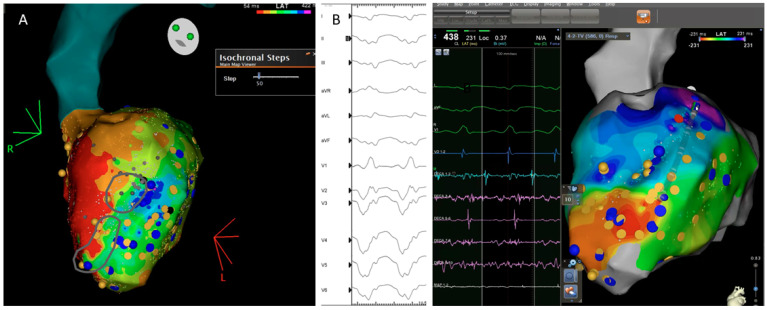
Figure 5.
Correlation between the ventricular tachycardia (VT) circuit with critical diastolic pathway (A) and deceleration zone (DZ) location during sinus rhythm as depicted during ILAM mapping (B). Late isochronal activation map is shown in the left side of the panel (8 isochrones). Two deceleration zones are observed (more than 3 isochrones in less than 1 cm radius) in the anterior wall. The termination site of VT (on the right) colocalized to the DZs.

