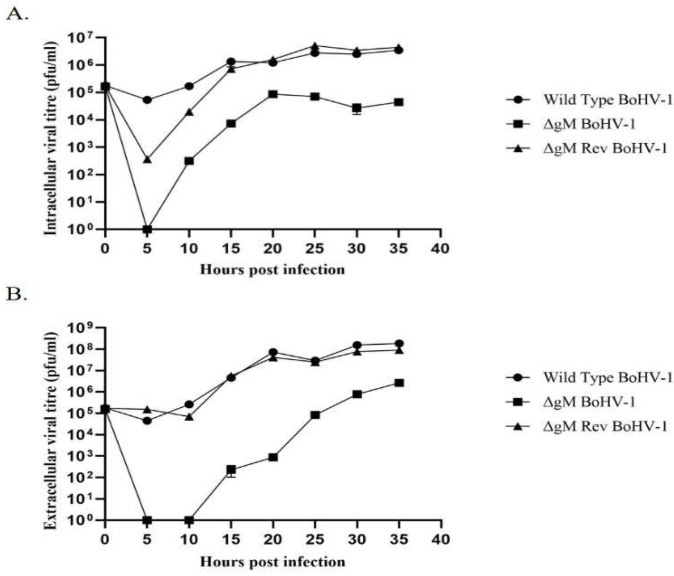
Figure 9.
One-step growth curve of WT BoHV-1, ΔgM BoHV-1, and ΔgM Rev BoHV-1. MDBK cells were infected with WT BoHV-1, ΔgM BoHV-1, or ΔgM Rev BoHV-1 at a MOI of 0.1, and cells and supernatant media were collected at different times after infection. (A) Viral titer of the intracellular virus. (B) Viral titer of the extracellular virus. The error bars indicate standard deviation.

