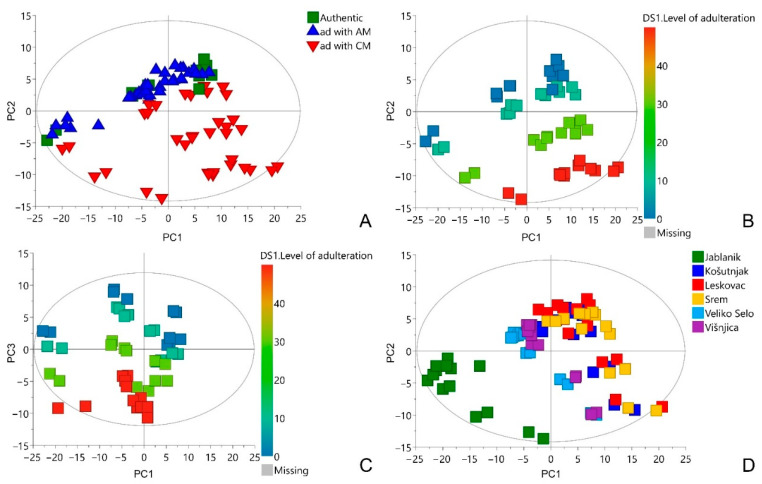
Figure 2.
PCA score plots: PC1/PC2 including all studied samples, the scores are colored based on added adulterants. Ad—adulteration, CM—C. majalis, AM—A. maculatum (A); PC1/PC2 including authentic sample and those spiked with C. majalis, the scores are colored based on the level of adulteration (B); PC1/PC3 including authentic sample and those spiked with A. maculatum, the scores are colored based on the level of adulteration (C); PC1/PC2 including all studied samples, the scores are colored based on the location of A. ursinum harvest (D).

