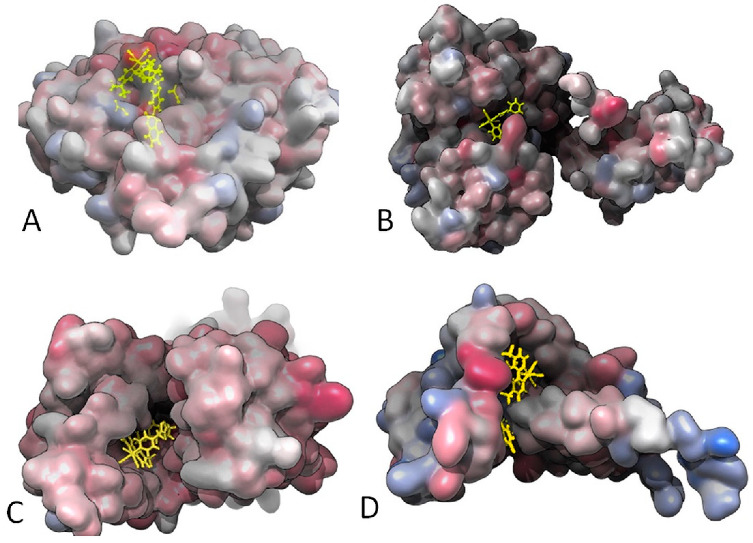
Figure 8.

Gaussian surface representation of the hydrophobicity of (A) 18 and Lipoteichoic acid synthase (LtaS; 2W5Q); (B) 15 and type-I signal peptidase (SpsB; 4WVJ); (C) 19 and Lipoteichoic acid flippase (LtaA), top view (6S7V); and (D) 19 and Lipoprotein signal peptidase II (LspA; 6RYP). The red-blue color palette changes from hydrophilic blue to hydrophobic red.
