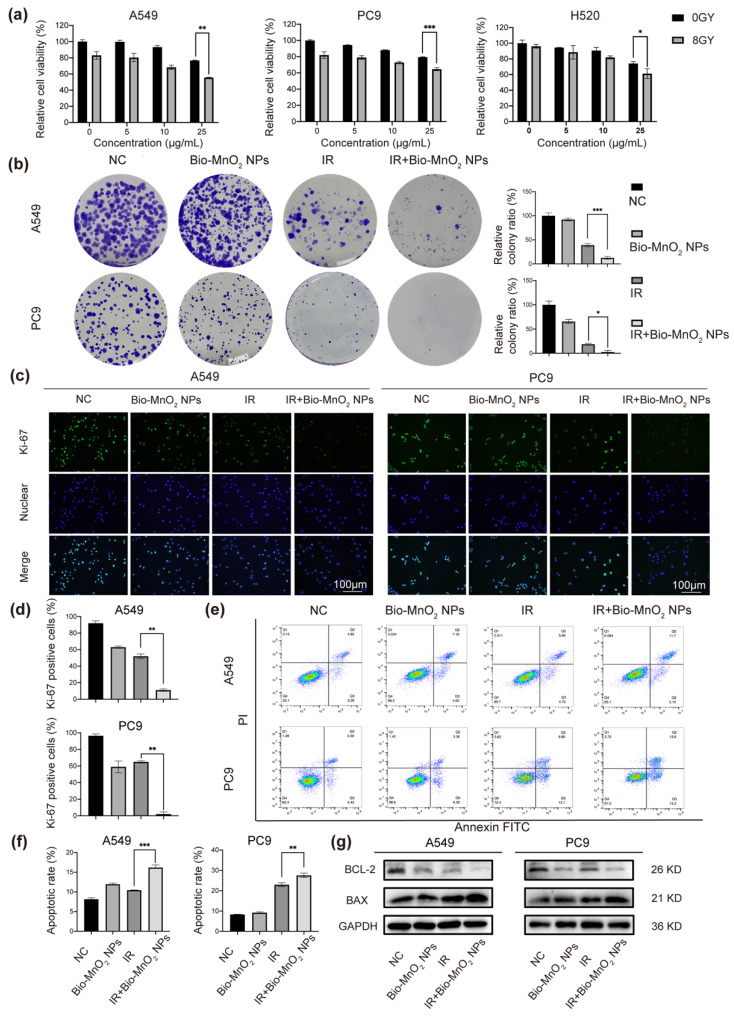
Figure 3.
Bio-MnO2 NPs enhanced radiotherapy (RT) in vitro. (a) Cell viabilities of A549, PC9 and H520 cells incubated with Bio-MnO2 NPs at various concentrations with or without X-ray radiation. (b) Colony formation assay of NSCLC cells after different treatments and statistical graphs of colony formation assay. (c,d) Representative images and statistical graphs of Ki-67 immunofluorescence. Scale bar, 100 μm. (e,f) Cell apoptosis assay via flow cytometry. (g) Immunoblotting of cell apoptosis related proteins. *, p < 0.05; **, p < 0.01; ***, p < 0.001.

