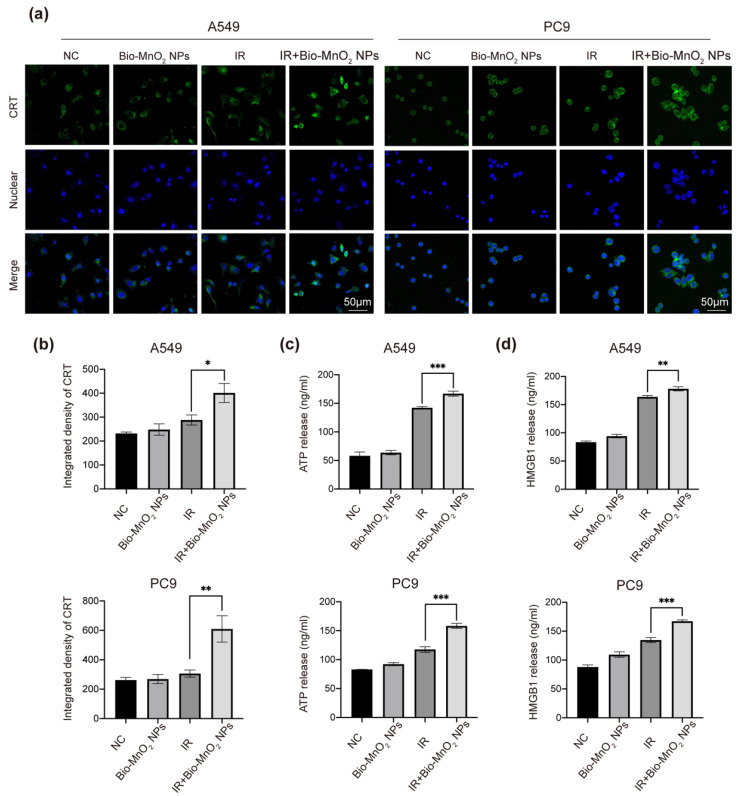
Figure 6.
Bio-MnO2 NPs plus radiation induced immunogenic cell death (ICD). (a,b) Representative images and statistical graphs of calreticulin (CRT) immunofluorescence (green) in different groups. Scale bar, 50 μm. (c) The secretion of ATP detected by ELISA after different treatments in NSCLC cells. (d) The secretion of high-mobility group box 1(HMGB1) detected by ELISA. *, p < 0.05; **, p < 0.01; ***, p < 0.001.

