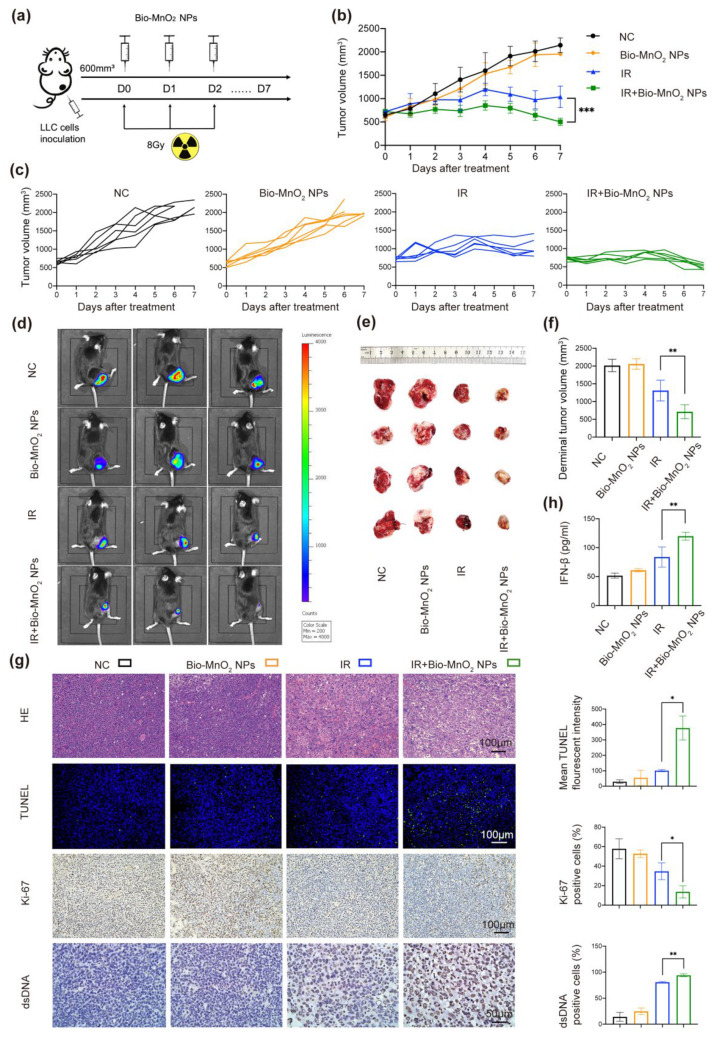
Figure 7.
Bio-MnO2 NPs enhanced RT in vivo. (a) Schematic illustration of the experiment in vivo. (b) Growth curve of tumor volume after different treatments: negative control (NC), Bio-MnO2 NPs, IR and IR + Bio-MnO2 NPs. (c) Tumor growth curve of each mouse. (d) Representative fluorescence of tumors. (e) Representative images of tumors. (f) Tumor volumes from each group when the mice reached the welfare end point. (g) Representative images and statistical graphs of H&E, Ki-67, TUNEL, dsDNA staining of tumors tissues. (h) Cytokine levels of IFN-β in sera after different treatments. *, p < 0.05; **, p < 0.01; ***, p < 0.001.

