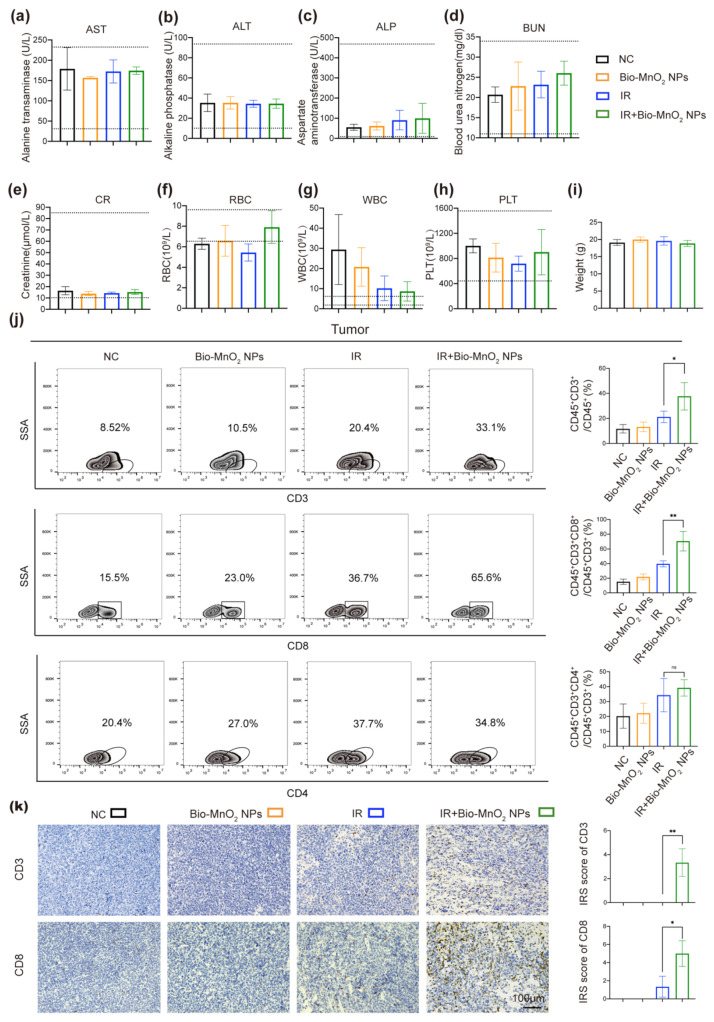
Figure 8.
Bio-MnO2 NPs plus radiation activated immune responses in vivo. (a–e) Comparison of liver (ALT, AST, ALP) and kidney function (BUN, CR) in different groups. (f–h) Comparison of the blood routine (RBC, WBC, PLT) in different groups. (i) Body weight of the mice when the mice reached the welfare end point. (j) Flow cytometry of CD45+CD3+, CD45+CD3+CD8+ and CD45+CD3+CD4+ T cells in tumor tissues. (k) Representative images and statistical graphs of CD3, CD8 staining in tumors tissues. ns, no significance; *, p < 0.05; **, p < 0.01.

