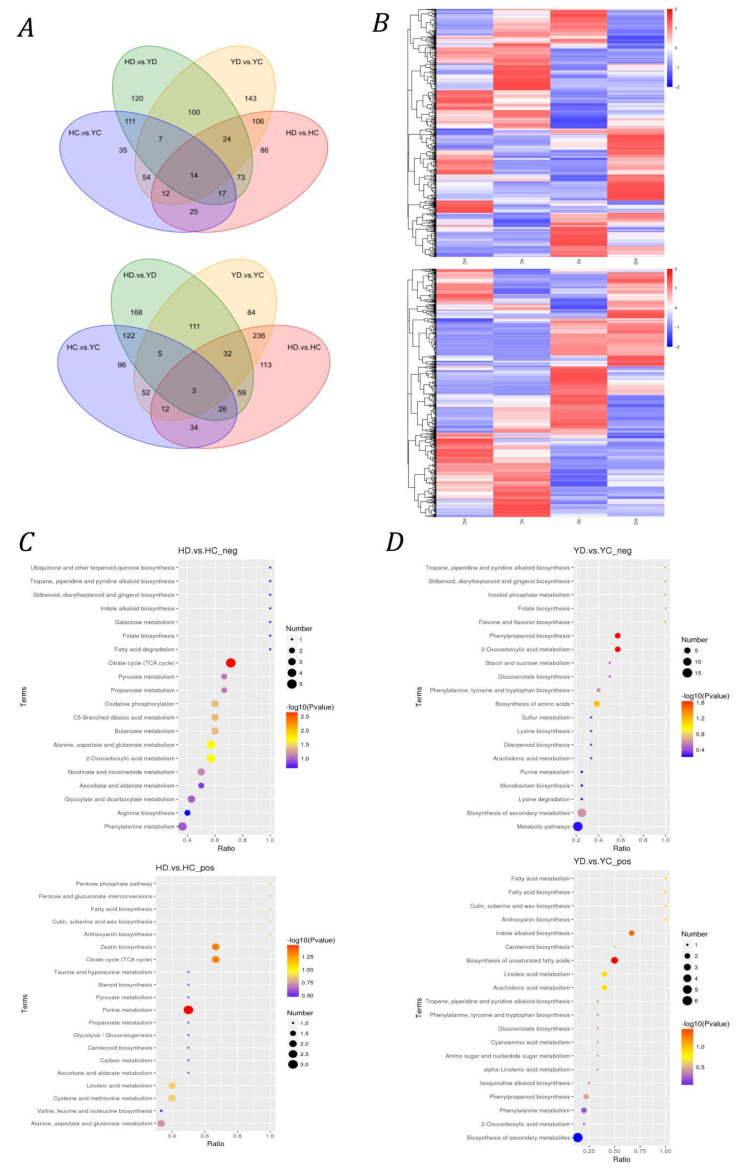
Figure A2.
Differential analysis and functional analysis of metabolites. (A): Venn diagram of the number of different metabolites. (B): Heatmap of the expression of metabolites that differ in positive ion mode and negative ion mode. (C): KEGG enrichment analysis of the DEMs in the HD vs. HC comparison. (D): KEGG enrichment analysis of the DEMs in the YD vs. YC comparison.

