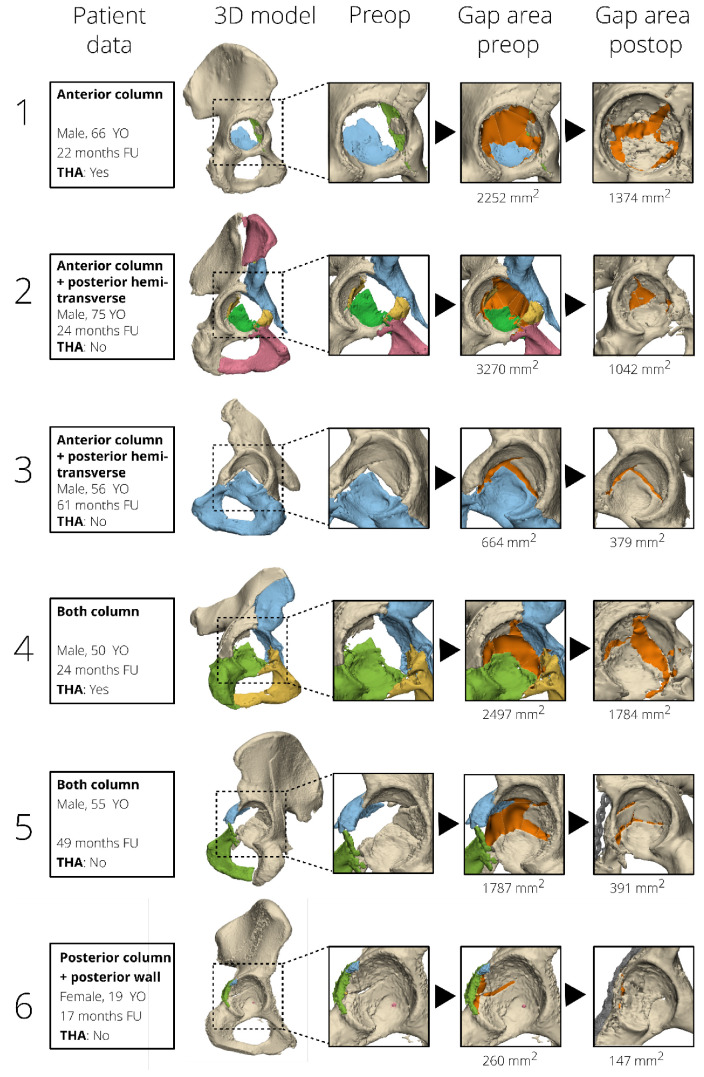
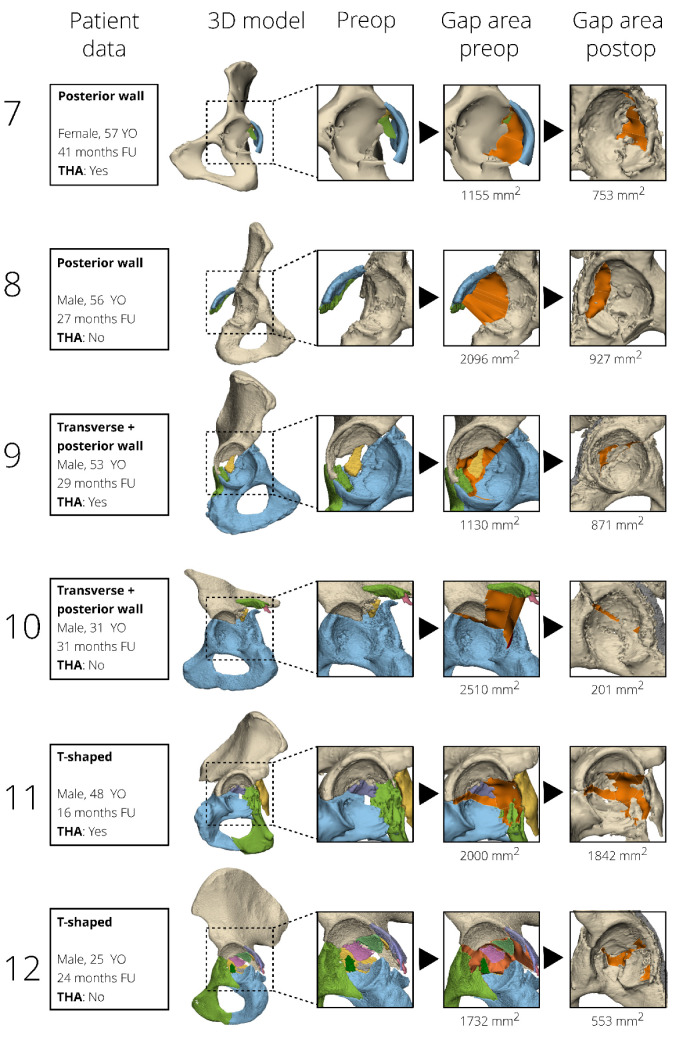
Figure 4.
Case examples of 12 patients, surgically treated for different types of acetabular fractures, are presented in order to correlate fracture displacement (as measured by the 3D gap area, orange) to clinical outcome. The pre- and postoperative 3D gap area are indicated in orange. The cases are sorted based on fracture type. YO: years old, FU: follow-up, THA: total hip arthroplasty.


