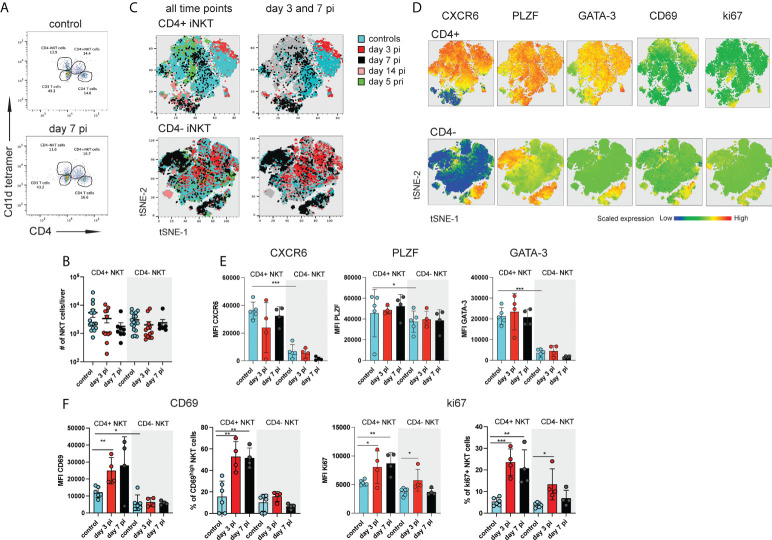
Figure 1.
Distinct subsets of hepatic iNKT cells are activated during NrHV infection. C57BL/6 mice (n=4-8 per time point) were infected i.v. with 104 genome equivalents (GE) NrHV and a flow cytometric analysis of hepatic iNKT cells was performed at multiple time points post primary infection (pi), post-secondary infection (pri) and in age-matched controls. (A) FACS plot showing hepatic αGalCer tet+ CD4+ and CD4- iNKT cell subsets at day 0, 7 pi. Gated on CD3+ T cells. (B) Total numbers of iNKT cell subsets during early NrHV infection. (C) tSNE representation of flow data comparing hepatic CD4+ (upper panel) and CD4- (lower panel) iNKT cells at multiple stages of NrHV infection and controls. For generation of tSNE plots data from 4 representative mice per time point was used. (D) Expression levels of CXCR6, PLZF, GATA-3, CD69 and ki67 in the cell populations show in (C). (E) Mean fluorescence intensity (MFI) of CXCR6, PLZF and GATA-3 in CD4+ and CD4- iNKT cell subsets at day 3 and 7 pi and controls. (F) MFI and percentage of positive cells for CD69 and ki67. t test: *p< 0.5, **p<0.01, ***p<0.001.

