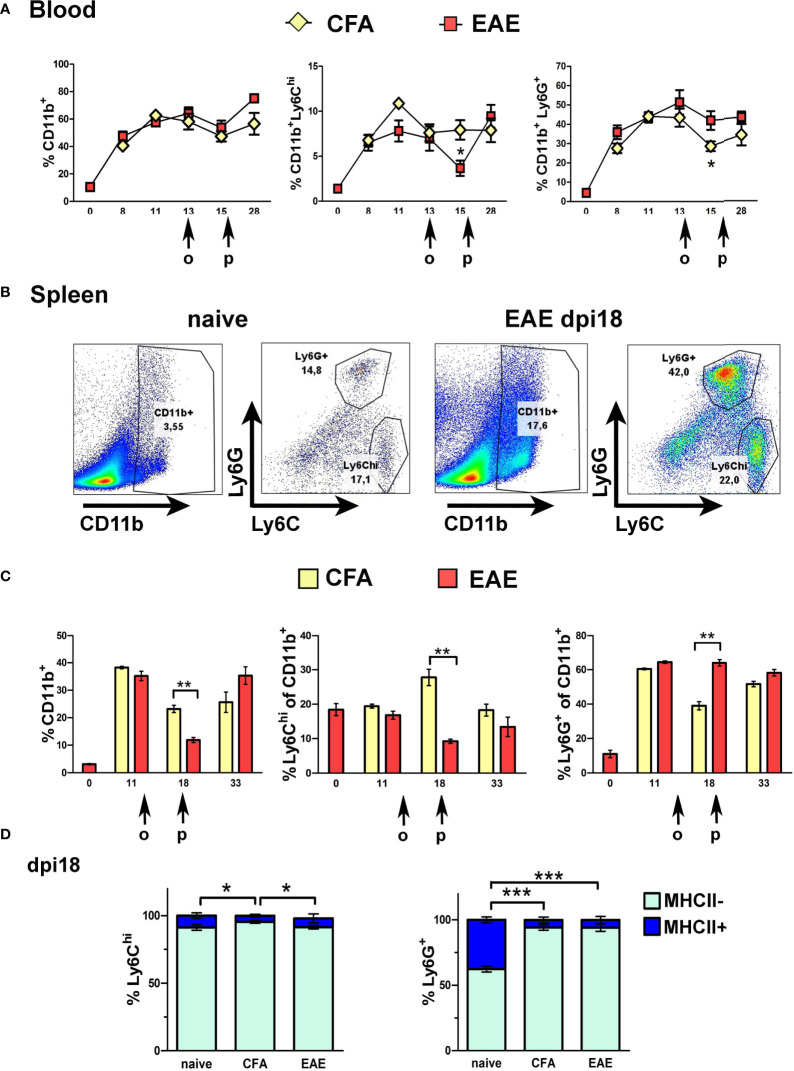
Figure 1.
Ly6Chi and Ly6G+ myeloid cells expand in the blood and spleen in response to immunization. (A) Time-course of CD11b+, Ly6Chi and Ly6G+ myeloid cell expansion in blood of CFA and EAE immunized mice (n=2 at day 0 and n=4-5/group/time-point). Arrows indicate the days of onset (o) and peak (p) of clinical symptoms in the EAE mice. (B) Gating strategy of CD11b+ sub-populations in spleens of naïve and EAE mice at the peak of clinical symptoms (dpi 18). (C) Time-course of CD11b+, Ly6Chi and Ly6G+ myeloid cell expansion in spleens of CFA and EAE immunized mice (n=3-4/group/time-point). Arrows indicate the days of onset (o) and peak (p) of clinical symptoms in the EAE mice. (D) Proportions of MHCII- and MHCII+ splenocytes within the Ly6Chi and Ly6G+ subpopulations in CFA and EAE immunized mice at the peak of clinical symptoms (dpi 18) (n=3/group). Data and statistical analysis are derived from one experiment in each case (one for A, C, one for B, D). Statistical significance is shown after pairwise comparisons between groups using Student’s t test (A, C) or multiple comparisons using one-way ANOVA followed by Tukey’s post hoc test (D) (*p ≤ 0.05, **p ≤ 0.01, ***p ≤ 0.001).

