Figure 2.
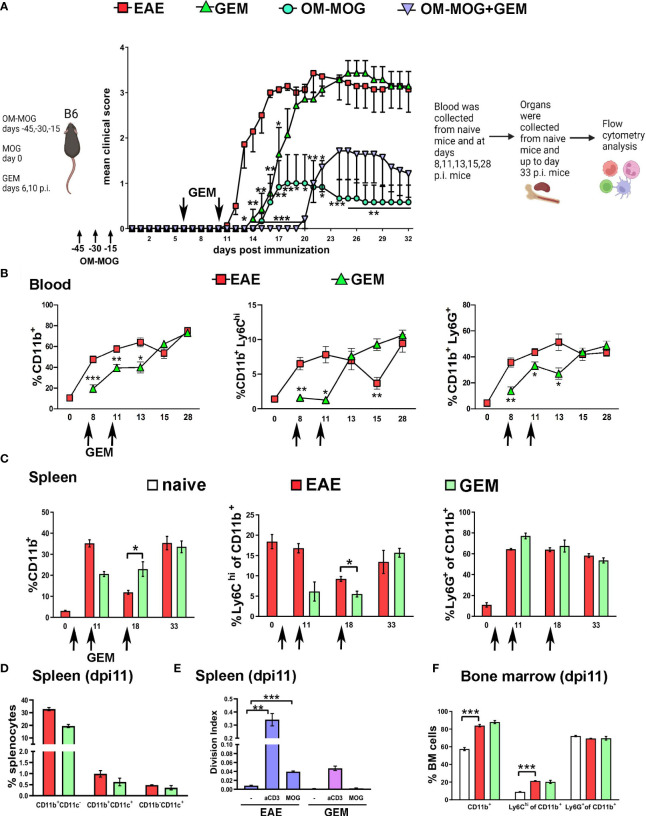
Gemcitabine transiently delays EAE onset and extends protection by OM-MOG. (A) Schematic representation of the experimental approach and the time points of injection of OM-MOG and gemcitabine (GEM) in the EAE mice. Mean clinical scores of EAE mice after long-term prophylactic administration of OM-MOG (days -45, -30, -15 relative to immunization for EAE, upward arrows) and pre-onset administration of GEM (dpi 6 and 10, downward arrows) (n=6-7/group). (B) Time-course of CD11b+, Ly6Chi and Ly6G+ myeloid cell expansion in blood of EAE mice untreated or treated with GEM (dpi 6 and 10; arrows) (n=2 at day 0 and n=4-5 mice/group/time-point). (C) Time-course of CD11b+, Ly6Chi and Ly6G+ myeloid cell expansion in spleens of EAE mice untreated or treated with GEM (dpi 6, 10 and 17; arrows) (n=2-3/group/time-point). (D) Proportions of different populations of myeloid cells, including CD11b+CD11c-, CD11b+CD11c+ (myeloid DC) and CD11b-CD11c+ DC cells, in spleens of EAE mice untreated or treated with GEM shown in C, at dpi 11 (n=2-3/group). (E) T cell proliferation responses to MOG or anti-mouse CD3e in spleens of EAE mice untreated or treated with GEM shown in C, at dpi 11 (n=2-3/group). Data are expressed as division index (total number of divisions/cells at start of culture). (F) Proportions of CD11b+, Ly6Chi and Ly6G+ myeloid cells in bone marrow of EAE mice untreated or treated with GEM shown in C, at dpi 11, and naïve mice (n=2-3/group). Data and statistical analysis are derived from one experiment in each case (one for A, one for B–F). Statistical significance is shown after comparisons to the vehicle (EAE) group using Mann-Whitney test (A), or pairwise comparisons between groups using Student’s t test (B–D, F) or Student’s t test followed by Bonferroni post hoc test (E) (*p ≤ 0.05, **p ≤ 0.01, ***p ≤ 0.001).

