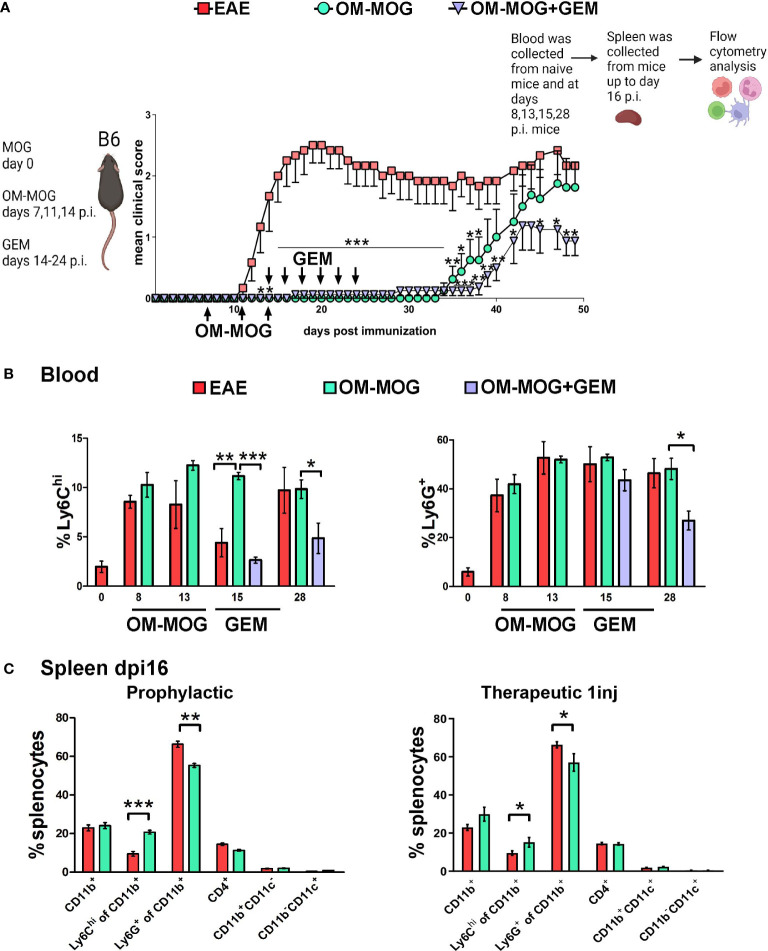
Figure 3.
OM-MOG retains Ly6Chi monocytes in the periphery during the induction of EAE. (A) Schematic representation of the experimental approach and the time points of injection of OM-MOG and gemcitabine (GEM) in the EAE mice. Mean clinical scores of EAE mice after short-term prophylactic administration of OM-MOG (dpi 7, 11 and 14, upward arrows) and post-onset administration of GEM (dpi 14 and every 2 days, downward arrows) (n=6-8/group). (B) Time-course of Ly6Chi and Ly6G+ cell expansion in blood of EAE mice untreated or treated with GEM, as shown in A (n= 3-4/group/time-point). (C) Proportions of CD11b+, Ly6Chi, Ly6G+, CD11b+CD11c+ (myeloid DC) and CD11b-CD11c+ (DC) myeloid cells and CD4+ T cells in spleen of EAE mice after short-term prophylactic (as shown in A., left panel) or therapeutic (24 h post-injection, right panel) administration of vehicle or OM-MOG, at peak of disease in the vehicle mice (dpi 16) (n=8 for EAE and n=4 for OM-MOG). Data and statistical analysis are derived from one experiment in each case (one for A, B, one for C). Statistical significance is shown after comparison to the vehicle (EAE) group using Mann-Whitney test (A), one-way ANOVA followed by Tukey’s post hoc test (B), or Student’s t test (C) (*p ≤ 0.05, **p ≤ 0.01, ***p ≤ 0.001).

