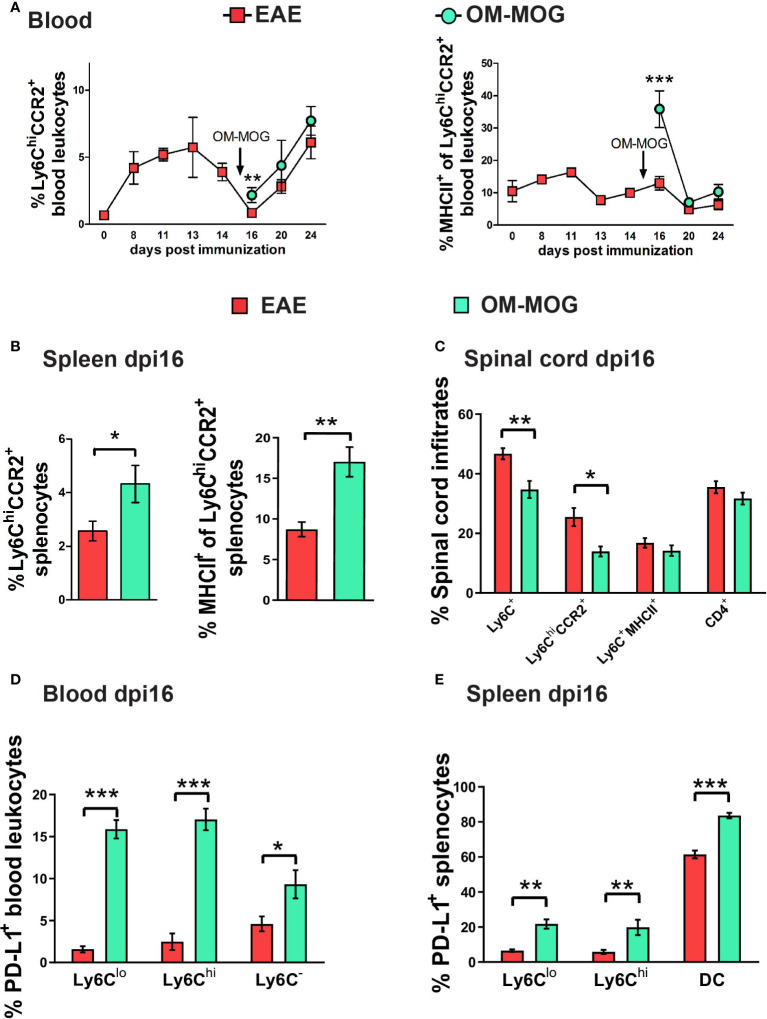
Figure 5.
Therapeutic OM-MOG alternatively activates and retains Ly6ChiCCR2+ monocytes in the periphery of EAE mice, while inhibiting infiltration of the spinal cord. (A) Time-course of proportions of Ly6ChiCCR2+ monocytes (left graph) and Ly6ChiCCR2+ monocytes expressing MHCII (right graph) in blood of EAE mice treated therapeutically with vehicle or OM-MOG from dpi 15 (arrow) every two days (n=3 at day 0 and n=3-10/group/time-point). (B) Proportions of Ly6ChiCCR2+ monocytes (left graph) and Ly6ChiCCR2+ monocytes expressing MHCII (right graph) in spleen of EAE mice at disease peak (dpi 16) 24 hours after 1 therapeutic injection of vehicle (EAE) or OM-MOG 15 (arrow in A). (C) Proportions of Ly6ChiCCR2+ and Ly6C+MHCII+ cells and CD4+ T cells in CNS-infiltrating mononuclear cells recovered from spinal cord of mice shown in A at disease peak (dpi 16) 24 hours after 1 therapeutic injection of vehicle (EAE) or OM-MOG (n=8 for EAE and n=4 for OM-MOG). Proportions of PD-L1-producing, (D) CD11c-Ly6Clo, CD11c-Ly6Chi myeloid cells and Ly6C- cells in blood (n=6 for EAE and n=4 for OM-MOG), and (E) CD11c-Ly6Clo, CD11c-Ly6Chi myeloid cells and CD11c+Ly6C- DC in spleen (n=8 for EAE and n=4 for OM-MOG) of mice shown in A at disease peak (dpi 16) 24 hours after 1 therapeutic injection of vehicle (EAE) or OM-MOG. Data and statistical analysis are from one experiment. Statistical significance is shown after pairwise comparisons between groups using Student’s t test (*p ≤ 0.05, **p ≤ 0.01, ***p ≤ 0.001).

