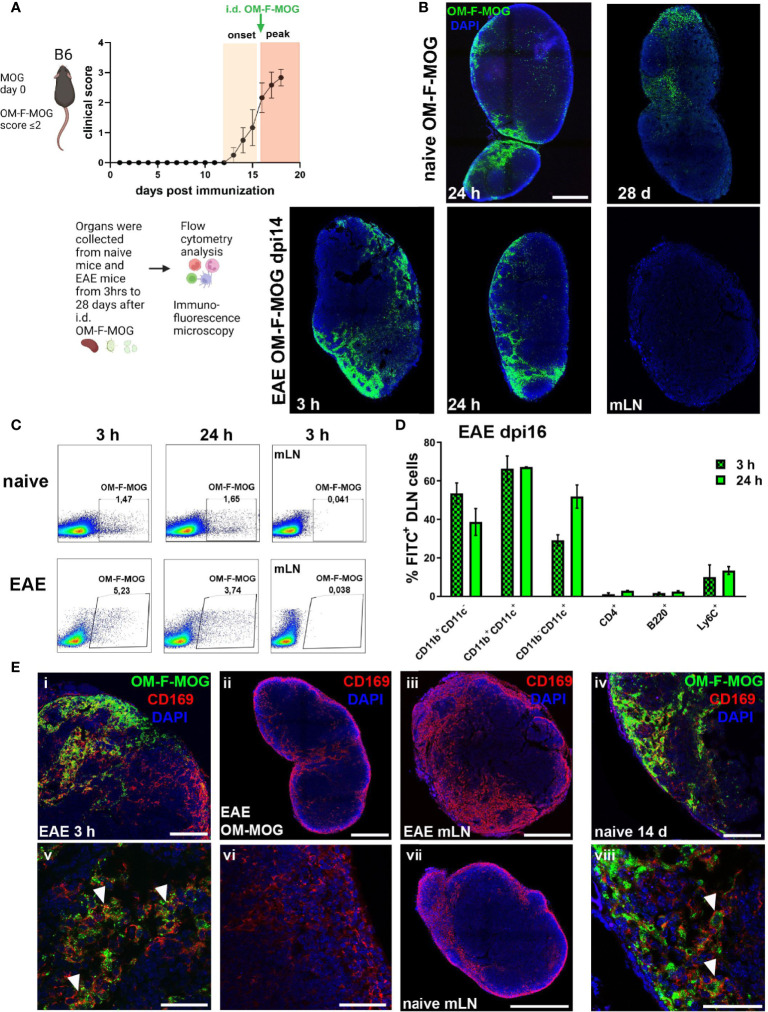
Figure 6.
Soluble OM-MOG rapidly localizes to CD169+ subcapsular macrophages in the skin DLN: (A) Schematic representation of the overall experimental approach and the time point of injection of OM-F-MOG in the EAE mice. (B) Frozen sections of draining skin LN (DLN) and mesenteric LN (mLN) recovered from naïve (top row) and EAE mice at dpi 14 (bottom row), after a single i.d. injection of OM-F-MOG, showing the distribution of FITC fluorescence (green) at the indicated time-points and counter-stained with DAPI (blue). Representative images are shown from 1 mouse (naïve) and 1 of 2 mice (EAE). Scale bar 500 μM; 10x objective.(C) Flow cytometry plots of DLN cells (first 2 panels in each row) and mLN cells (3rd panels) recovered from naïve and EAE mice at dpi 16, after a single i.d. injection of OM-F-MOG, at the indicated time-points. Representative plots from 1 mouse (naïve) and 1 of 2 mice (EAE). (D) Proportions of FITC+ cells in different cell populations of the DLN, recovered from EAE mice 3 h and 24 h after a single therapeutic i.d. injection of OM-F-MOG (n=2 mice/time point). (E) Frozen sections of DLN and mLN, as shown in (A), immunostained with anti-CD169 (red) and counterstained with DAPI (blue). Tissues were collected from EAE mice at 3 h (i, iii, v) and 24 h (ii, vi), or naïve mice at 14 d (iv, vii, viii), after a single i.d. injection of OM-F-MOG or, as anti-CD169 immunostaining control, OM-MOG without FITC (ii, vi). Scale bars 500 μM, 10x objective (ii, iii, vii); 100 μM; 20x objective (i, iv); 50 μM; 63x objective (v, vi, viii). Representative images from 1 mouse (naïve) and 1 of 2 mice (EAE). Data are from two independent experiments, one for A, D (immunohistochemistry), and one for B, C (flow cytometry).

