Figure 8.
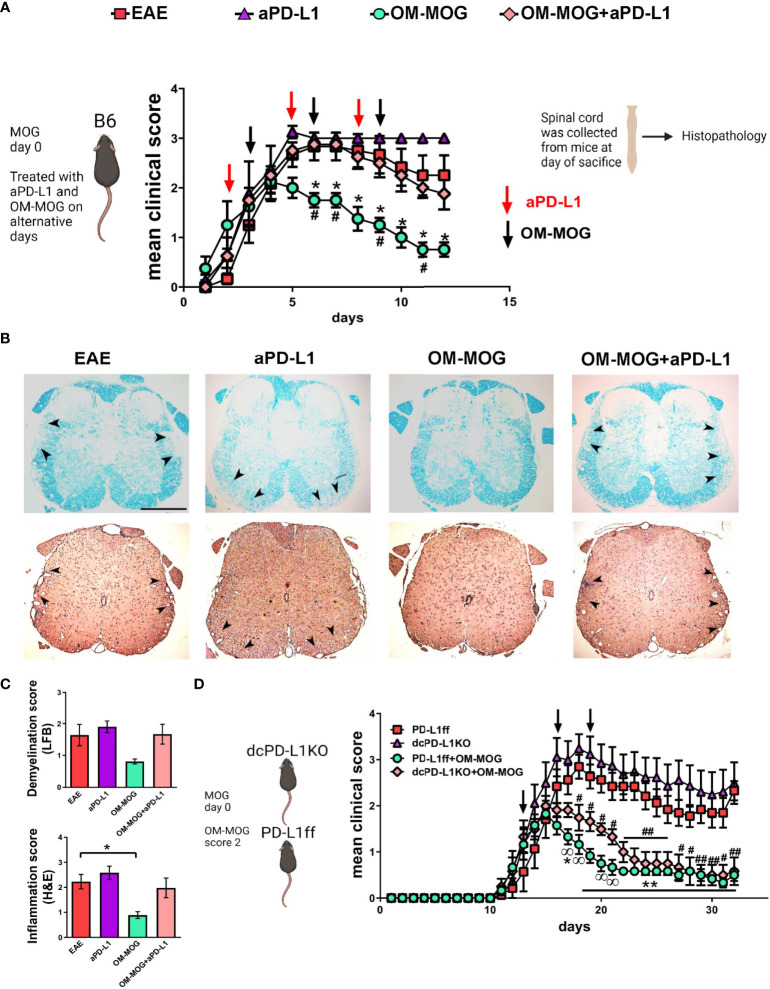
The protective effects of OM-MOG in EAE are abolished by PD-L1 neutralization and not altered by DC-specific PD-L1 knockout. (A) Schematic representation of the overall experimental approach and the time points of injection of OM-MOG and anti-PD-L1 neutralizing antibody in the EAE mice. Mean clinical scores of EAE mice treated therapeutically with vehicle (EAE), OM-MOG (black arrows), anti-PD-L1 neutralizing antibody (red arrows), or both OM-MOG and anti-PD-L1 antibody (n=4-6/group). Disease onset was synchronized according to the start of disease in each mouse, occurring between dpi 10-12, so that each mouse was monitored for the same number of days and received the same number of injections. (B) Histopathological analysis of spinal cord sections taken from mice shown in (A) at the completion of the experiment. Demyelination was measured by Luxol fast blue staining (LFB; upper panels) and inflammatory infiltration by haematoxylin-eosin staining (H&E; lower panels). Confluent inflammatory demyelinating lesions characteristic of EAE are seen in mice treated with vehicle (EAE), anti-PD-L1 antibody and both OM-MOG and anti-PD-L1 antibody (arrowheads), in contrast to markedly reduced lesions in mice treated with OM-MOG. Representative images from 1 of 4 or 6 (EAE) mice/group are shown. Scale bar 500 μM. (C) Semi-quantitative analysis of LFB and H&E-stained spinal cord sections of the mice shown in (A). 6-7 sections per mouse were analyzed (n=4-6 mice/group). (D) Mean clinical scores of PD-L1ff and dcPD-L1KO EAE mice treated therapeutically with vehicle (EAE) or OM-MOG (black arrows) (n=6-8/group). Data and statistical analysis are from one experiment in each case (one for A-C, one for (D). Statistical significance is shown after comparisons between groups using Mann-Whitney test (A, *EAE vehicle versus OM-MOG; #OM-MOG vs OM-MOG+anti-PD-L1) (D, *PD-L1ff EAE vehicle versus PD-L1ff+OM-MOG; #PD-L1ff EAE vehicle versus dcPD-L1KO+OM-MOG;
 PD-L1ff+OM-MOG versus dcPD-L1KO+OM-MOG), and one-way ANOVA followed by Tukey’s post hoc test (C) (*, #,
 p ≤ 0.05, **, ## p ≤ 0.01).

