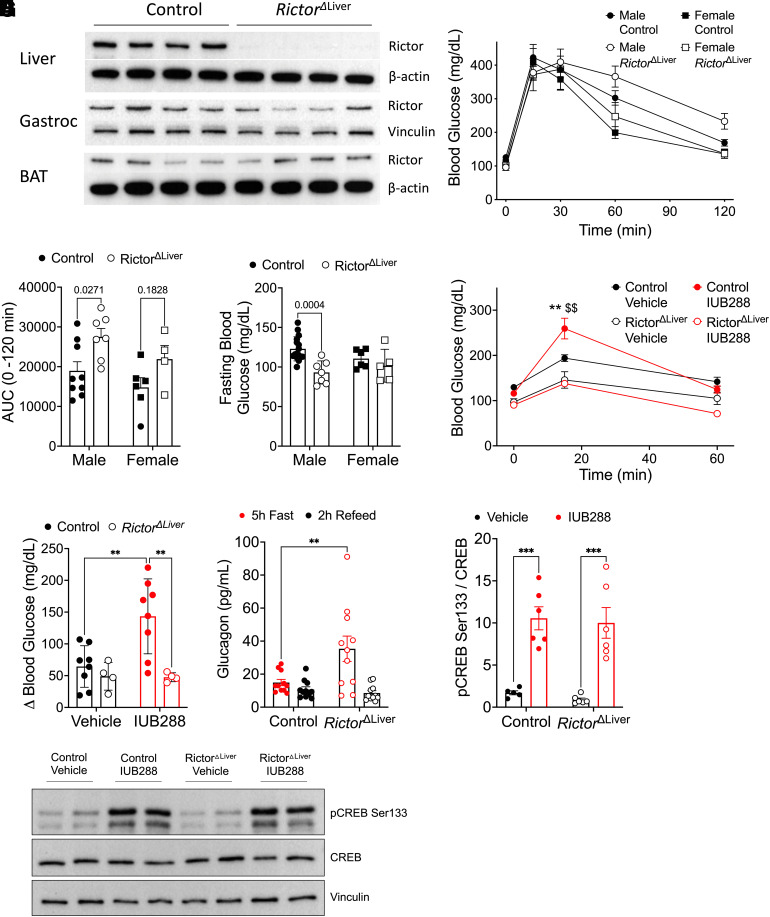
Figure 2.
RictorΔLiver mice show glucose intolerance, lower blood glucose, and nonresponse to GCGR agonism. A: Western blot analysis of RICTOR (180 kDa) and β-actin or vinculin confirming liver-specific knockout. B: Blood glucose during GTT in male and female mice after 5-h fast. C: Area under the curve analysis of glucose excursion during GTT. D: Fasting blood glucose (5 h) in male and female mice. E: Blood glucose excursion during IUB288 challenge in male mice after 5 h fast. F: Change in blood glucose after vehicle or GCGR agonism challenge (t = 0–15 min) in male mice. G: Circulating glucagon in RictorΔLiver and littermate control mice after 5 h fast or 2 h (chow) refeed. H and I: Liver CREB phosphorylation in RictorΔLiver and littermate control mice 20 min after IUB288 challenge. All data are represented as mean ± SEM in 16-week-old mice with control mice represented by closed symbols and RictorΔLiver mice by open symbols (n = 4–7 mice/group). *P < 0.05, **P < 0.01 vs. genotype control, $$P < 0.01 vs. vehicle control, using two-way ANOVA (C, D, and F–H) or three-way ANOVA (B and E). B: Interaction of genotype and time (P < 0.01). AUC, area under the curve; Gastroc, gastrocnemius.

