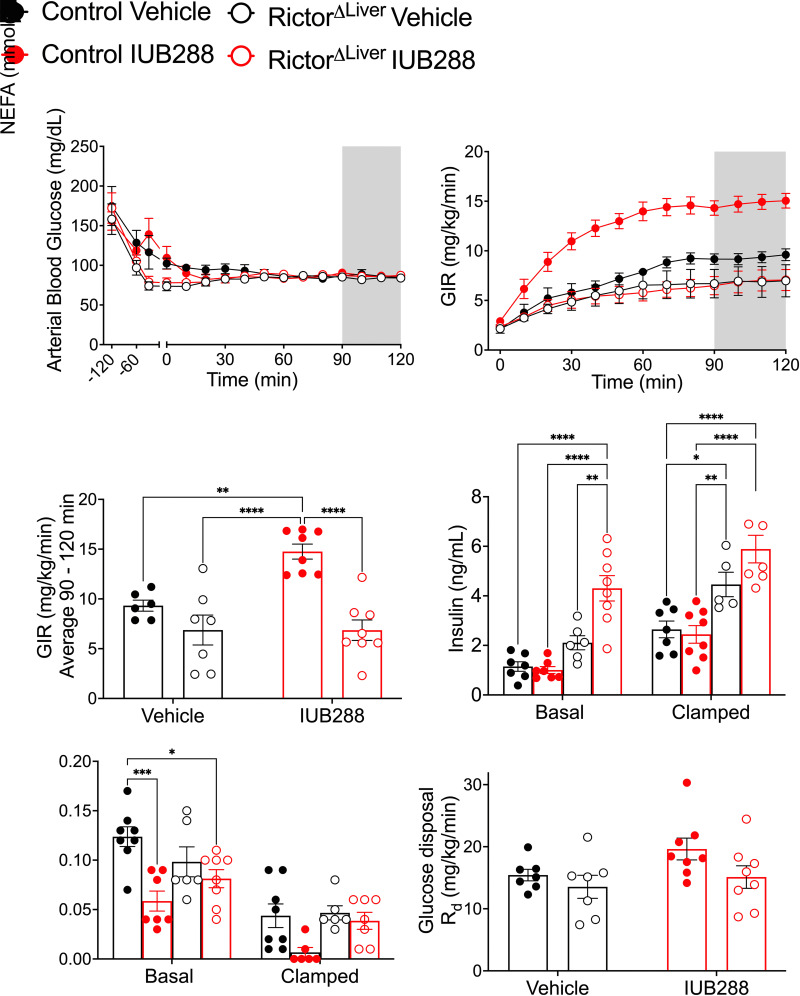
Figure 3.
GCGR agonism enhances whole-body insulin sensitivity during euglycemic clamp. A: Time course of arterial blood glucose level from −120 min to 120 min. B: GIR during insulin infusion period. C: The average of GIR during steady state (shaded area of A and B) from 90 to 120 min. D: Plasma insulin level under basal and clamped conditions. E: Plasma NEFA under basal and clamped conditions. F: Glucose disposal rate (Rd). All data are represented as mean ± SEM in 20- to 24-week-old mice with control mice represented by closed symbols and RictorΔLiver mice by open symbols (n = 6–7 mice). *P < 0.05, **P < 0.01, ***P < 0.001, ****P < 0.0001, using two-way ANOVA (C and F) or three-way ANOVA (B, D, and E). B: Interaction of time, treatment, and genotype (P = 0.0003).

