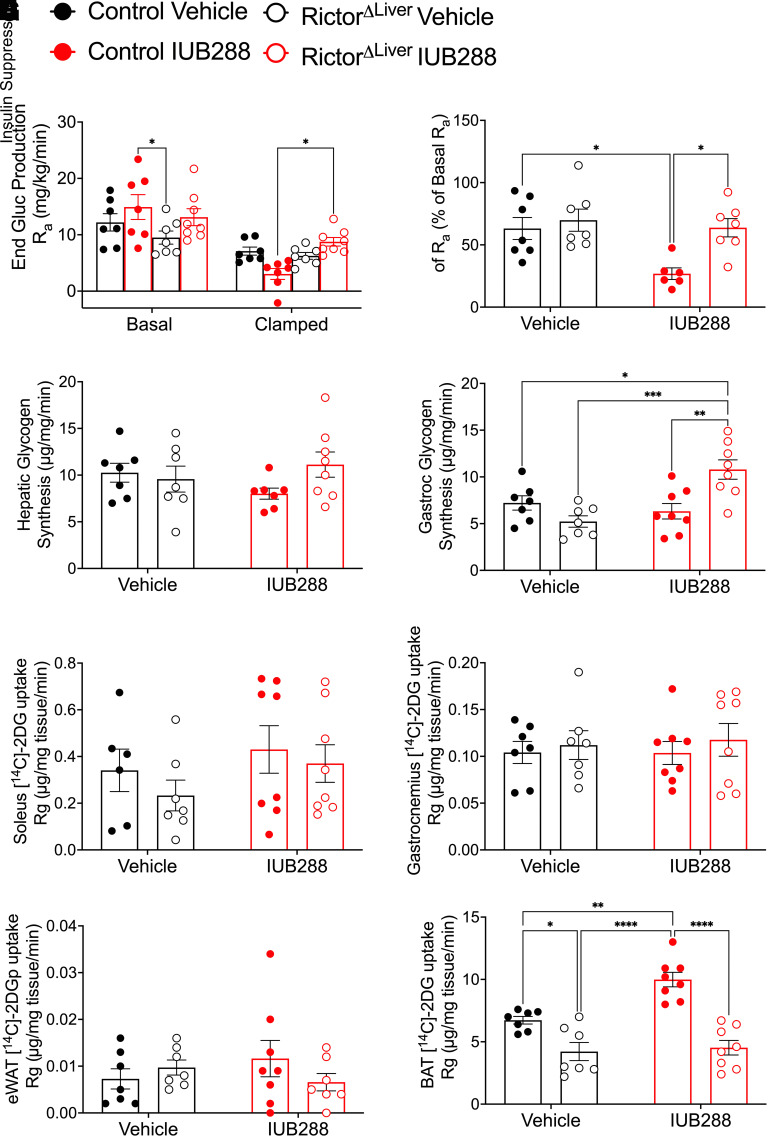
Figure 4.
GCGR agonism enhances insulin-stimulated hepatic glucose production during euglycemic-clamp. A: Endogenous glucose (End Gluc) production rate (Ra). B: Insulin-stimulated percent change of Ra. C and D: Glycogen synthesis rate in the liver (C) and gastrocnemius (D). E–H: [1-14C]2DG uptake rate into soleus (E), gastrocnemius (F), eWAT (G), and BAT (H). All data are represented as mean ± SEM with control mice represented by closed symbols and RictorΔLiver mice by open symbols (n = 6–7 mice). *P < 0.05, **P < 0.01, ***P < 0.001, ****P < 0.0001 using two-way ANOVA (B–G) or three-way ANOVA (A).

