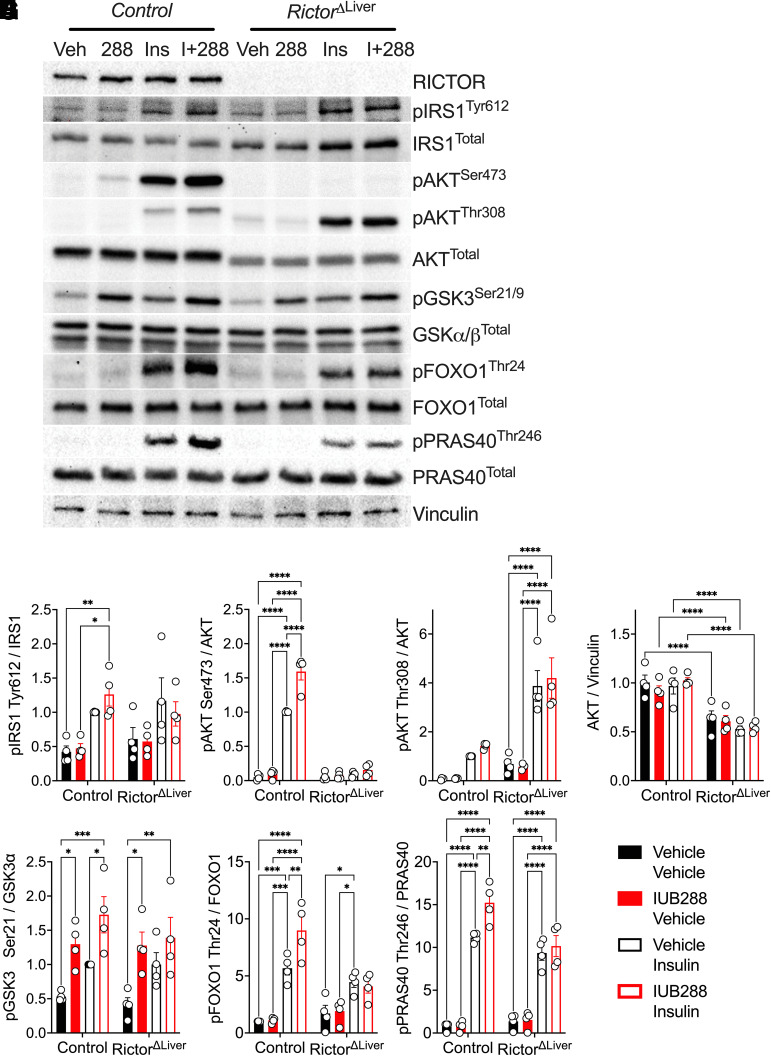
Figure 6.
The phosphorylation of AKTSer473 is mTORC2 dependent and cell autonomous. Representative images of Western blot analysis for insulin signaling in primary hepatocytes isolated from control and RictorΔLiver mice (A). Quantitative data of pIRS1Tyr612/IRS1 (B), pAKTSer473/AKT (C), pAKTThr308/AKT (D), AKTtotal (E), pGSK3α/βSer21/9/GSK3 (F), pFOXO1Thr24/FOXO1 (G), and pPRAS40Thr246/PRAS40 (H). All data are represented as mean ± SEM in 6- to 8-week-old mice. *P < 0.05, **P < 0.01, ***P < 0.001, and ****P < 0.0001, using two-way ANOVA. Veh, vehicle.

