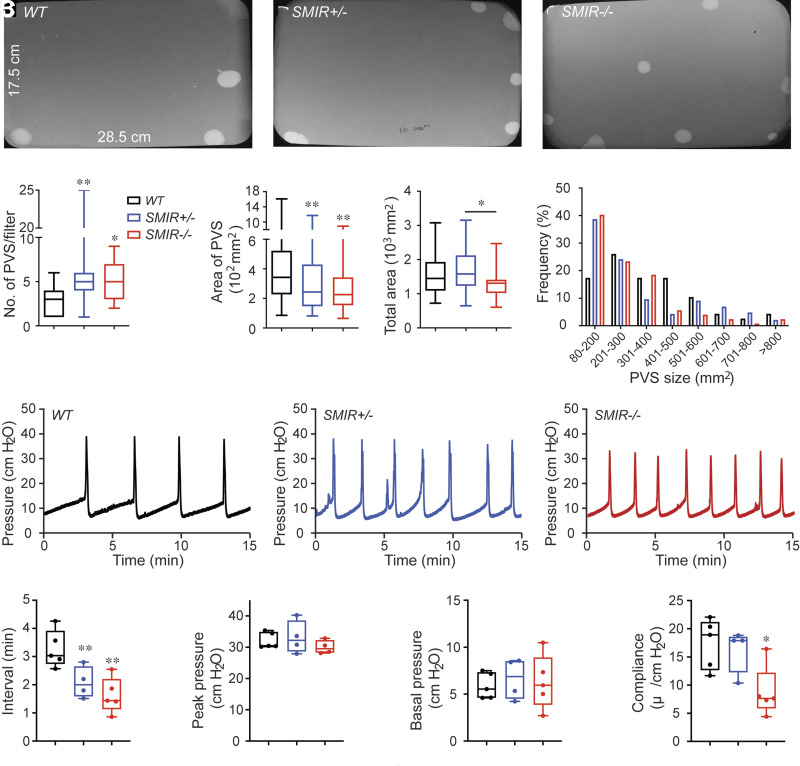
Figure 2.
SMIR+/− and SMIR−/− mice have altered voiding phenotype and urodynamics. A–C: Representative filters show ultraviolet light–illuminated urine spots from female wild-type (WT) (n = 30), SMIR+/− (n = 28), and SMIR−/− (n = 27) mice. D–F: Summarized data of the numbers of PVS, area of PVS, and the total area of voiding spots per filter. G: Summarized frequency distribution chart of varied spot size. H–J: Representative CMG traces from female wild-type (n = 5), SMIR+/− (n = 4), and SMIR−/− (n = 5) mice. K–N: Summarized urodynamic data of voiding interval, peak pressure, basal pressure, and compliance from CMGs. Data are shown as boxes and whiskers. The centerline is the median of the data set, the box represents 75% of the data, and bars indicate whiskers from minimum to maximum. Data were analyzed with use of Student t test. *P < 0.05 and **P < 0.01.

