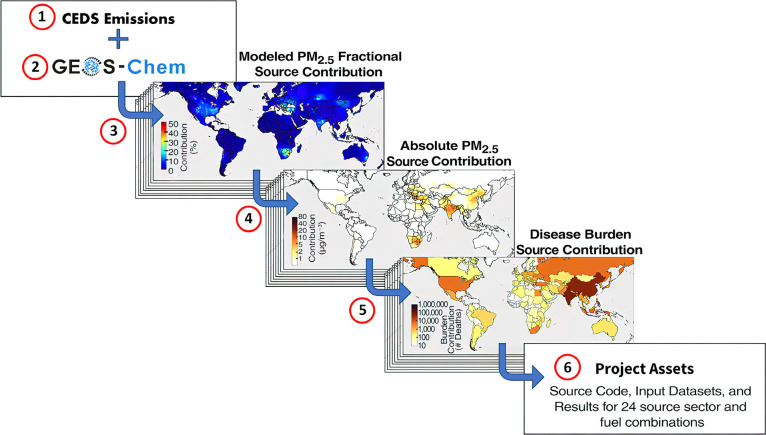
Figure 1.
General schematic of the GBD MAPS global project methods. Each step is indicated by a number and is described in the main text. As an illustrative example, the modeled fractional, absolute, and PM2.5 disease burden contributions from coal use in the energy sector are shown in Steps 3–5. These steps are repeated for each of the 24 individual source sector and fuel categories (Table 1). (Adapted from Hoesly et al. 2018; CC Attribution 4.0 License.)

