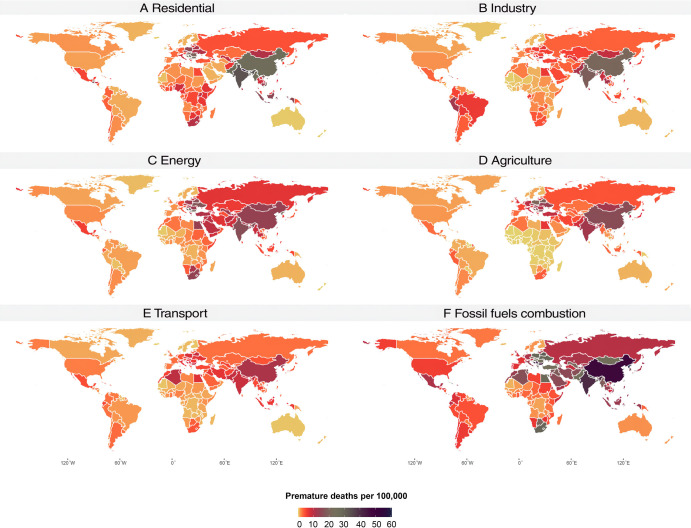
Figure 7.
Premature deaths per 100,000 attributable to population-weighted mean ambient PM2.5 mass from selected sectors in 2017. (A–E) The rate of deaths per 100,000 from residential, industry, energy, agriculture and transport (on road and nonroad) sectors in each country, respectively. (F) Deaths per 100,000 from all fossil fuel combustion (total coal plus liquid oil and natural gas) in each country.

