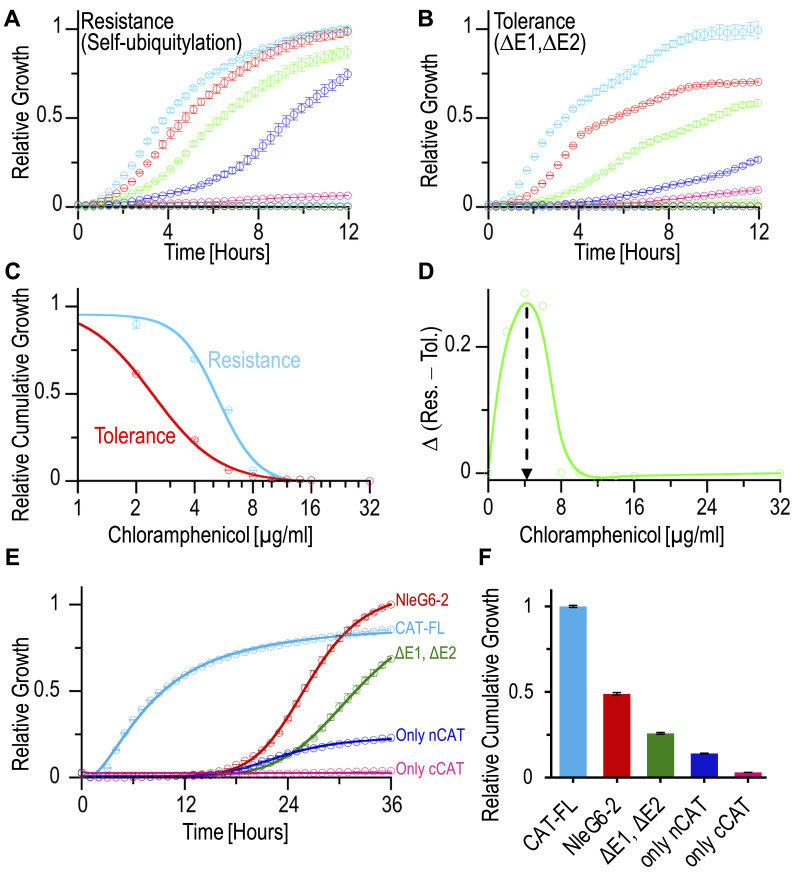
Figure 2. Self-ubiquitylation of NleG6-2 ubiquitin E3-ligase .
(A) Assays of NleG6-2 self-ubiquitylation dependent resistance under increased chloramphenicol (CAM) concentrations (0-light blue, 2-red, 4-green, 6-blue, 8-magenta, 10-dark green, 12-yellow, 16-cyan, and 32-brown μg/mL). (B) As a negative control for the experiment shown in A: tolerance growth for a strain that lacks ubiquitylation and resistance (∆E1, ∆E2) is shown. (C) Relative IC50 based on the cumulative growths (integrals) shown in A and B. (D) A curve showing the optimal CAM concentration to run downstream assays. (E) Spotting assay on LB agar Petri dish showing self-ubiquitylation of NleG6-2. The selection system provides a readout for self-ubiquitylation of NleG6-2 in red. Specific negative control for the ubiquitylation (∆E1, ∆E2) in green. Negative controls of only N- or C-CAT fragments are in blue and magenta, respectively. Positive control of the full-length CAT (CAT-FL) is in cyan. (F) The values in the bar-plot represent the ‘relative cumulative growth’ (integrals) of the growth curves shown in plot E.

