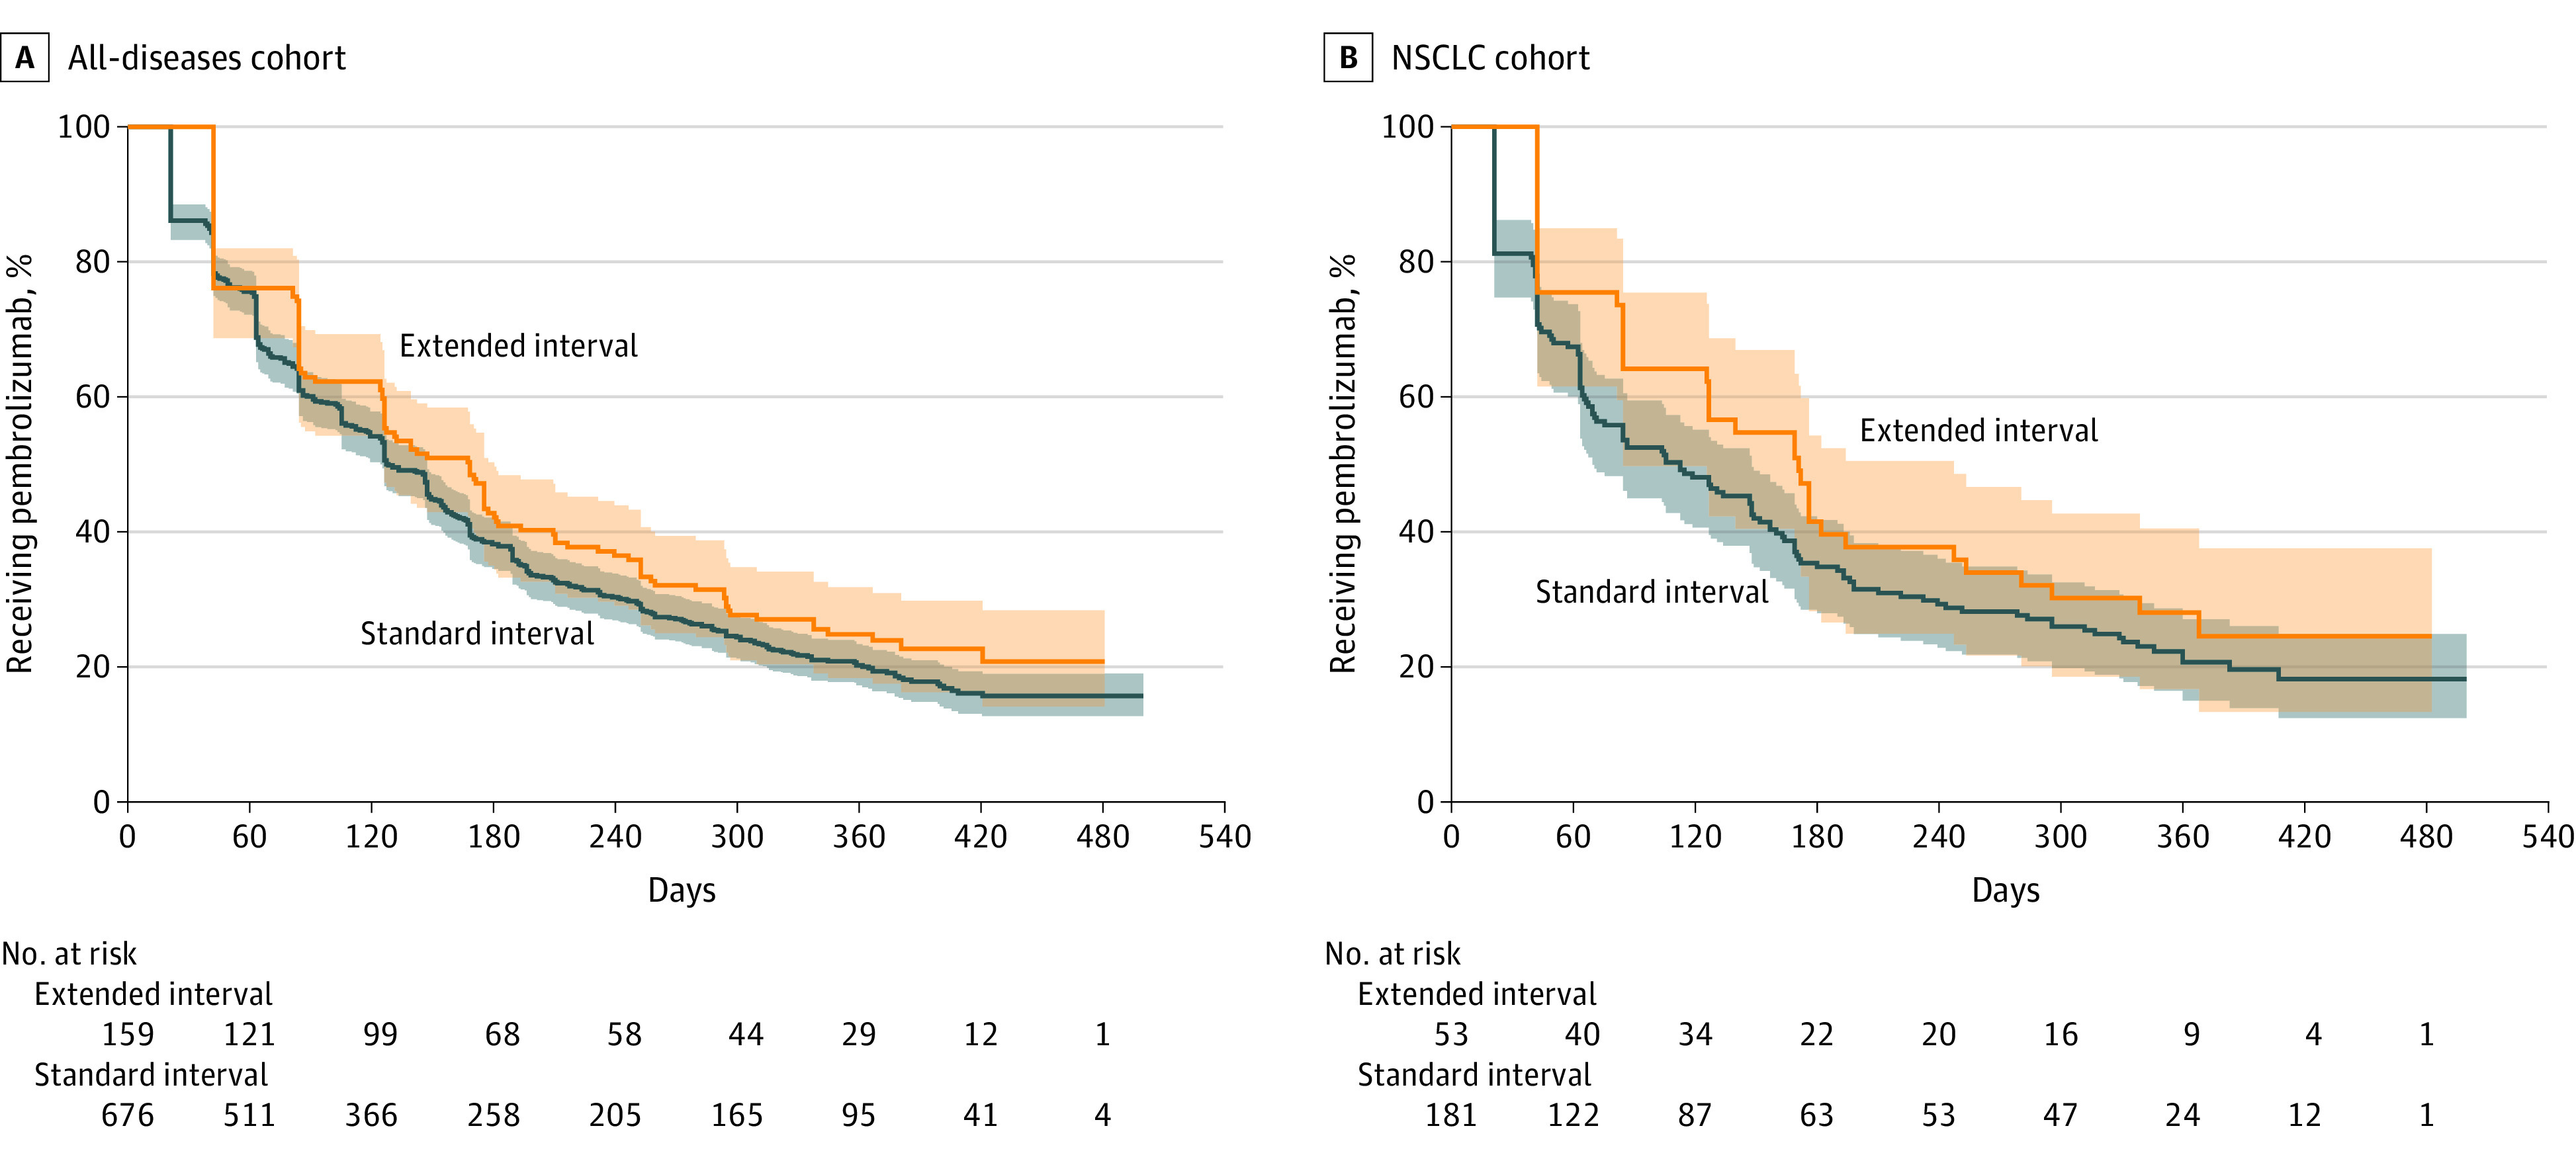
Figure 2. Survival Curves of Extended- and Standard-Interval Pembrolizumab Time-to-Treatment Discontinuation (TTD).

A, median TTD was 127.5 days for standard interval and 168 days for extended interval (HR, 1.00; 95% CI, 1.00-1.00; P = .08). B, Median TTD was 112 days for standard interval and 170 days for extended interval (HR, 1.00; 95% CI, 1.00-1.00; P = .15). In both, the y-axis is the proportion of patients still receiving pembrolizumab and the x-axis is number of days since incident pembrolizumab. In both panels, standard interval is blue and extended interval is orange. Shaded portions indicate 95% CIs.
