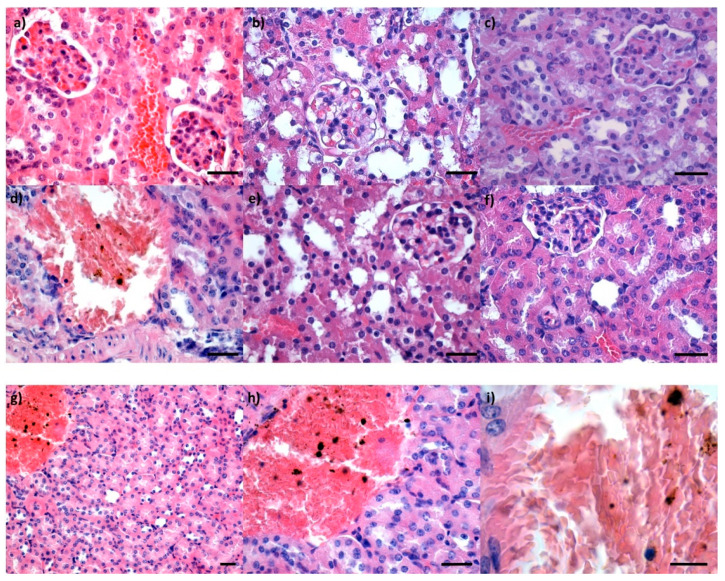
Figure 8.
Cross-section through a kidney from mice injected with Fe3O4 (a,d), Fe3O4@PEG 20 K (b,e) and Fe3O4@PEG 35 K NPs (c,f), respectively, and harvested at 2 days (a–c) and 10 days (d–f), respectively, after intravenous administration; Hematoxylin–Eosin staining; 400× magnification, scale bar 50 μm; figures (g–i) represent details of cross-section through kidney from mice injected with Fe3O4 NPs and harvested at 10 days after intravenous administration; Hematoxylin–Eosin staining; different magnifications: (a) 200×, scale bar 50 μm; (b) 400×, scale bar 50 μm; (c) 1000×, scale bar 25 μm.

