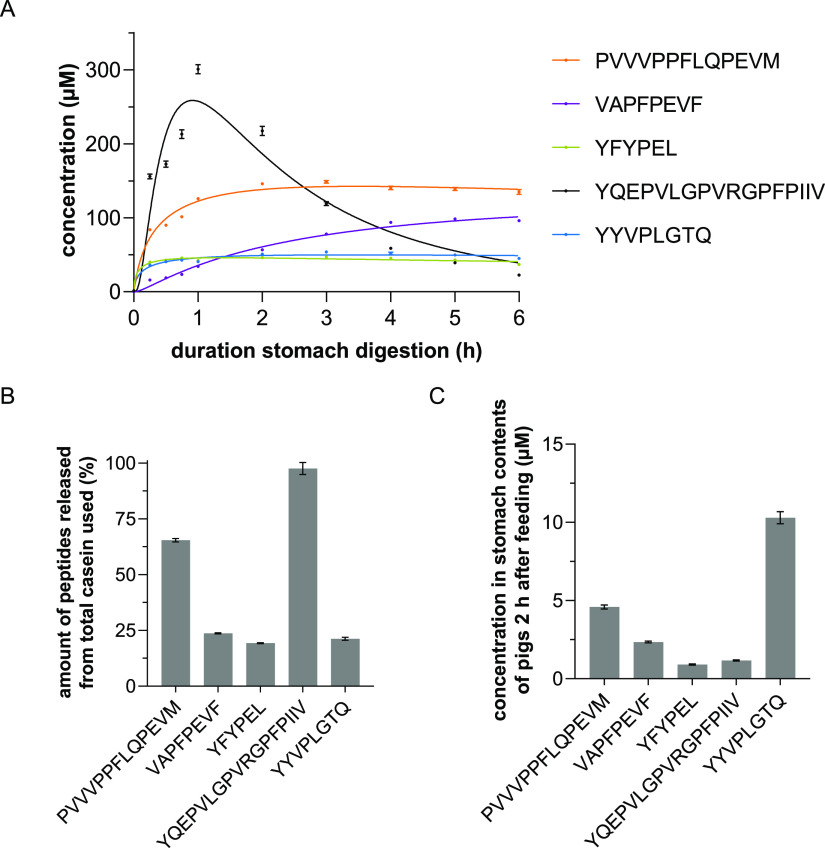
Figure 1.
(A) Peptide concentrations in the course of in vitro digestion. Samples were taken after 0, 0.25, 0.5, 0.75, 1, 2, 3, 4, 5, and 6 h of digestion and quantitated by means of targeted UHPLC–MS/MS-MRM measurements. Data shown as mean ± SEM, n = 4, transitions per peptide = 5. (B) Release rates of the five investigated peptides related to αS1- or β-casein after 2 h of in vitro digestion. Data are shown as mean ± SEM, n = 4, transitions per peptide = 5. (C) Concentrations of the five investigated peptides related to αS1- or β-casein after 2 h of in vivo digestion. Data are shown as mean ± SEM, n = 6, transitions per peptide = 5.

