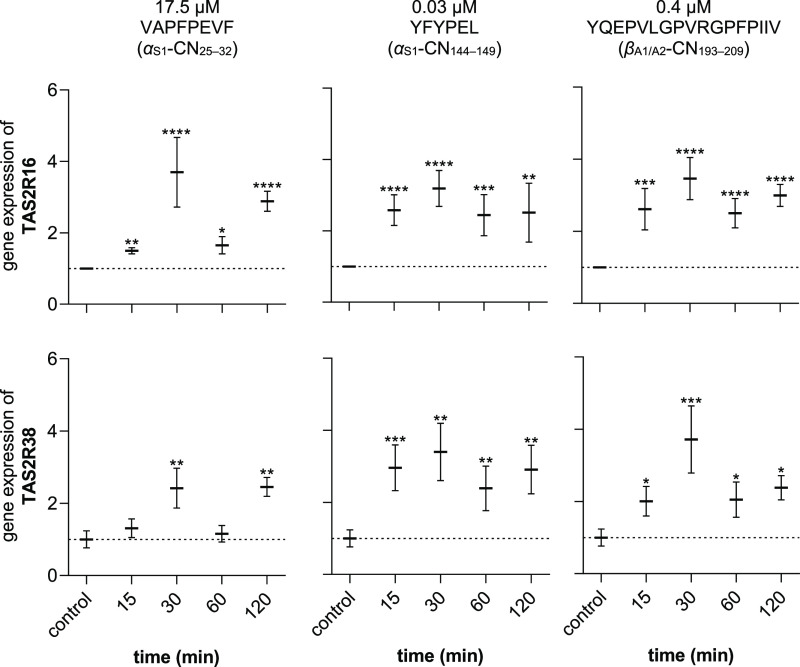
Figure 4.
Changes in gene expressions (fold change) of bitter receptors TAS2R16 (top) and TAS2R38 (bottom) after incubation with peptides VAPFPEVF (17.5 μM; left), YFYPEL (0.03 μM; center), and YQEPVLGPVRGPFPIIV (0.4 μM; right) for 15/30/60/120 min. Normalized to the expression of PPIA and GAPDH (reference genes). Data are shown as mean ± SEM, n = 3–5, t.r. = 3, statistics: t-test Holm-Šidák method; significant differences are expressed with * = p ≤ 0.05, ** = p ≤ 0.01, *** = p ≤ 0.001, **** = p ≤ 0.0001.

