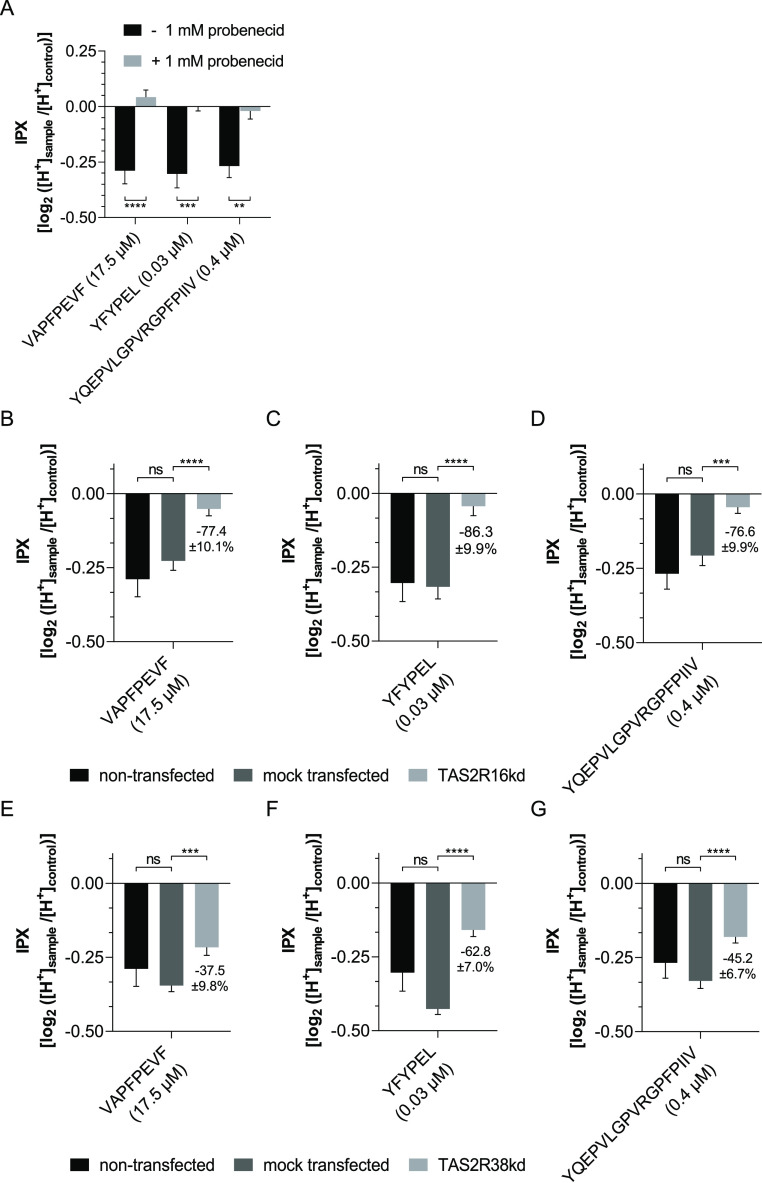
Figure 5.
Effect on proton secretion after incubation with VAPFPEVF (17.5 μM), YFYPEL (0.03 μM), and YQEPVLGPVRGPFPIIV (0.4 μM), respectively, of (A) HGT-1 cells with (light gray bars) and without (black bars) 1 mM probenecid; (B–D) non-transfected (black bars), mock-transfected (dark gray bars), and TAS2R16kd (light gray bars) HGT-1 cells; and (E–G) non-transfected (black bars), mock-transfected (dark gray bars), and TAS2R38kd (light gray bars) HGT-1 cells. Data are shown as mean ± SEM after incubation for 10 min, n = 4–8, t.r. = 4–12, control: KRHB, statistics: one-way ANOVA Holm-Šidák post hoc test; significant differences are expressed with ** = p ≤ 0.01, *** = p ≤ 0.001, **** = p ≤ 0.0001.

