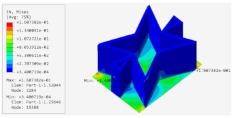
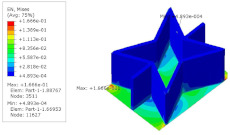
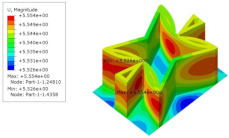
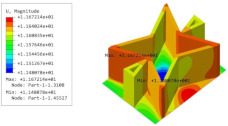
Table 5.
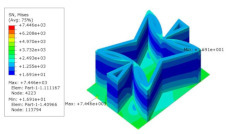
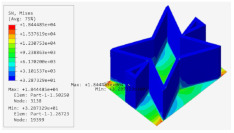
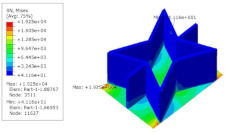
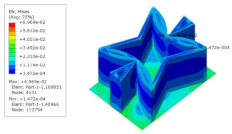
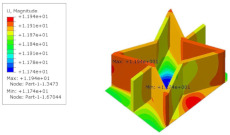
Comparison of recovered local stress, strain and displacement within the unit cell of PSC, STC and TH in case 2.
| Type | PSC | STC | SC |
|---|---|---|---|
|
|
|
|
|
|
|
|
| U |
 mm |
 mm |
 mm |
Comparison of recovered local stress, strain and displacement within the unit cell of PSC, STC and TH in case 2.
| Type | PSC | STC | SC |
|---|---|---|---|

|

|

|
|

|

|

|
|
| U |
 mm |
 mm |
 mm |