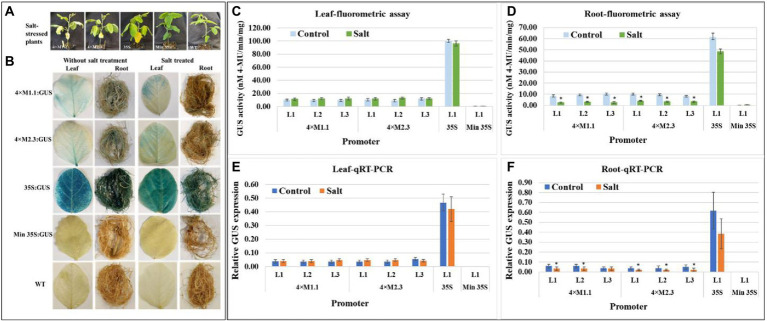
Figure 5.
GUS activity in leaves and roots of 3-week-old T3 transgenic soybean containing the individual promoter-GUS construct subjected to mock (untreated control) and salt treatment. (A) Representative plants were irrigated with 250 mM NaCl solution for 7 days. (B) Histochemical staining for GUS activity in transgenic soybean and wild-type (WT) plants. (C,D) Fluorometric assay for GUS activity in leaf (C) and root (D). (E,F) Quantitative real-time RT-PCR (qRT-PCR) analysis for GUS expression in leaf (E) and root (F). The relative levels of transcripts in qRT-PCR were normalized to soybean ubiquitin gene (GmUBI3). Three independent transgenic lines (L1, L2, and L3) were used for 4 × M1.1 and 4 × M2.3 promoter-GUS constructs. One transgenic line (L1) was used for 35S and minimal (Min) 35S promoter-GUS constructs. Bars represent mean values of six biological replicates ± standard error. Statistical analysis by a two-sample paired t-test (p < 0.05) indicated no significant differences between treated and untreated plants.

