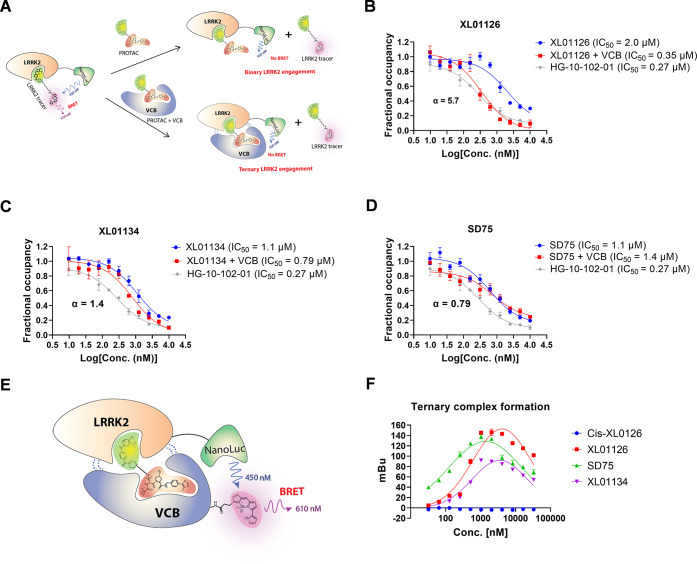
Figure 10.
Binary/ternary binding affinity, cooperativity, and ternary complex formation of XL01126, XL01134, and SD75. (A). Schematic illustration of the binary and ternary LRRK2 engagement assays. HG-10-102-01, XL01126 (B), XL01134 (C), and SD75 (D) were titrated into the lysate of HEK293 cells (transfected LRRK2-NanoLuc) alone (blue line) or preincubated with VCB (red line) in the presence of LRRK2 tracer. The fractional occupancy of the tracer is plotted against the concentrations of the compounds and fitted into the “nonlinear regression, one site-log IC50” model in GraphPad to obtain the IC50 values. The IC50 ratio between the blue curve and red cure is calculated as cooperativity (α). (E) Schematic illustration of the ternary complex formation assay (F). cis-XL01126, XL01126, SD75, and XL01134 were titrated into the lysate of HEK293 cells (transfected with LRRK2-NanoLuc) and 0.5 μM VCB protein labeled with Bodipy576/589. The NanoBRET signal was plotted against the compounds’ concentrations and fitted into “nonlinear regression, Gaussian” model in GraphPad. Error bars are mean ± SEM from three biological independent experiments.

