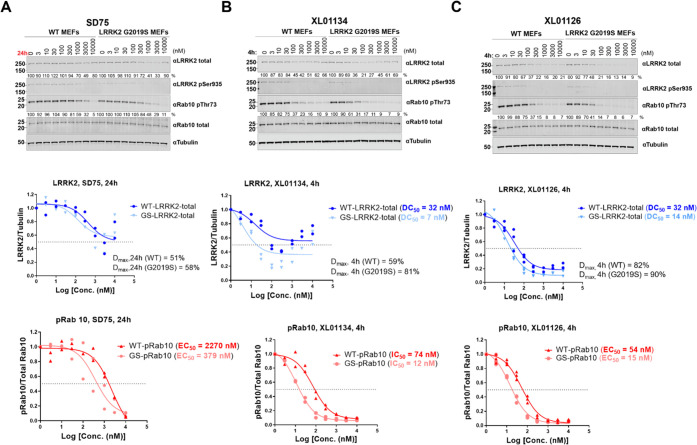
Figure 5.
Dose-dependent LRRK2 degradation, LRRK2 dephosphorylation, and Rab10 dephosphorylation by SD75, XL01134, and XL01126 in WT and G2019S LRRK2 MEFs. Representative Western blots of total LRRK2, LRRK2-pSer935, Rab10-pThr73, total Rab10, and tubulin levels after treating WT and G2019S LRRK2 MEFs with SD75 (A), XL01134 (B), or XL01126 (C) at the indicated concentrations for the indicated time period. The relative LRRK2 protein and pRab10 levels were obtained by quantifying the ratios of total LRRK2/tubulin or Rab10-pThr73/total Rab10, respectively, and the ratios were normalized to the DMSO-treated samples. The relative total LRRK2 and pRab10 levels were plotted against the compound concentration and fitted against “nonlinear regression, one site-fit Log IC50” in GraphPad to obtain the DC50 and EC50 values. Data were obtained from two to three biological independent experiments.

