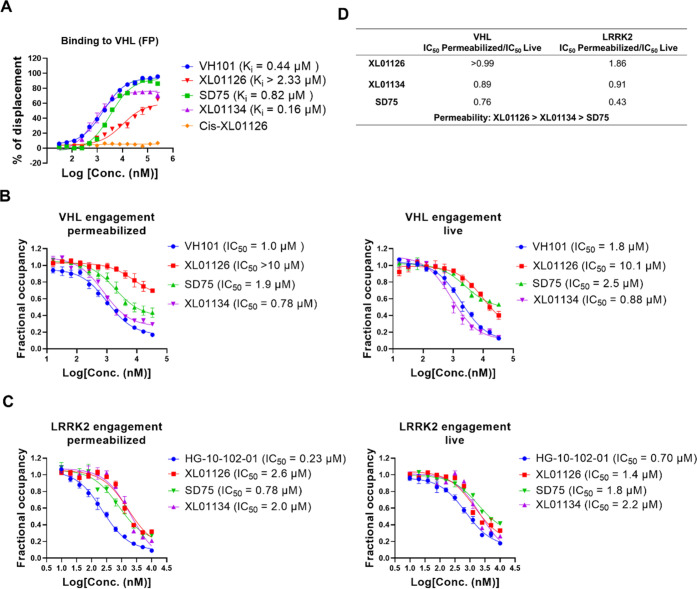
Figure 9.
Binding affinities to VHL and LRRK2. (A) Binding affinity of the tested compounds to VHL using the FP assay. The indicated compounds were titrated to a solution of VCB protein (10 nM) and JC9 (5 nM) (a FAM-labeled probe that binds to VCB) to displace JC9, and the percentage of displacement was plotted against the compounds’ concentration and fitted into the “nonlinear regression, one site-log IC50” to obtain the IC50 values, which were used to back-calculate the Ki values. NanoBRET target engagement assays of tested compounds to VHL (B) and LRRK2 (C) in permeabilized and live-cell modes. The indicated compounds were titrated into HEK293 cells transfected with VHL-NanoLuc (B) or LRRK2-NanoLuc fusion (C) in the presence of VHL tracer (B) or LRRK2 tracer (C). 0.25 and 0.5 μM VHL tracers were used for the permeabilized and live mode VHL engagement assays separately. 0.125 and 0.5 μM of LRRK2 tracer were used for the permeabilized and live mode LRRK2 engagement assays separately. The fractional occupancy of the tracers is plotted against the tested compounds’ concentrations and fitted into “nonlinear regression, one site-log IC50” to obtain the IC50 values of each compound against both permeabilized and live cells, separately. Data points are presented as mean ± SEM from three independent experiments. (D) The IC50 ratios between permeabilized and live mode target engagements of each compound were used to compare their permeabilities.

