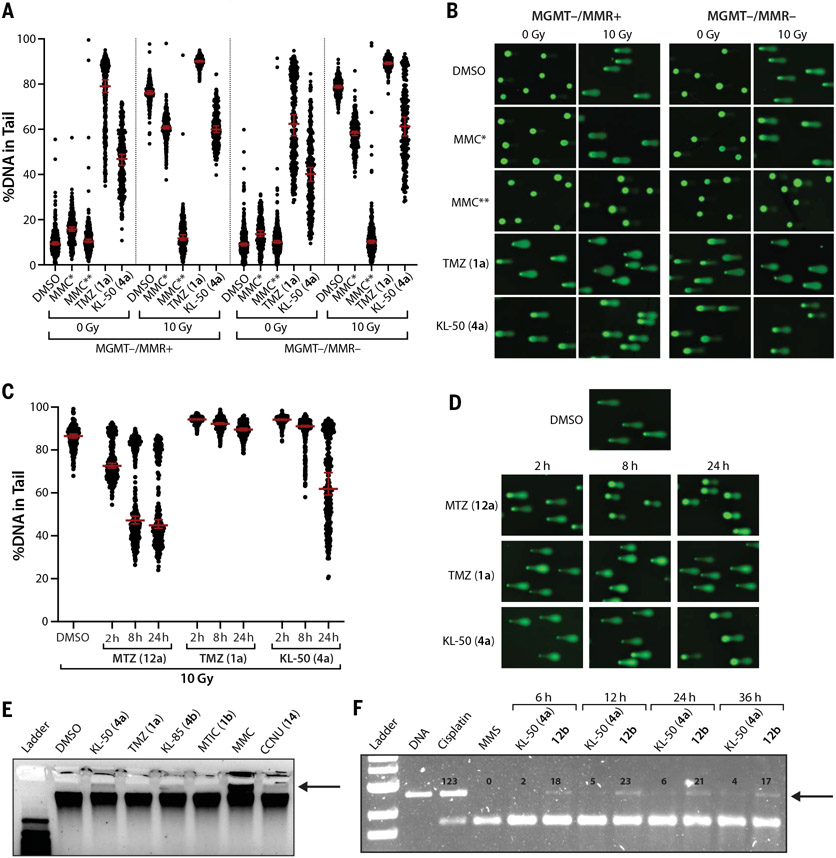
Fig. 3. Unrepaired primary KL-50 (4a) lesions convert to DNA ICLs in the absence of MGMT.
(A) Scatter dot plots of the percent DNA in tail upon single-cell alkaline gel electrophoresis performed on LN229 MGMT−/MMR+ and MGMT−/MMR− cells treated with 0.2% DMSO control, 200 μM TMZ (1a), 200 μM KL-50 (4a), or 0.1 μM MMC (MMC*) for 24 hours or with 50 μM MMC (MMC**) for 2 hours. After cell lysis, comet slides were irradiated with 0 or 10 grays (Gy) before alkaline electrophoresis. Lines indicate median; error bars indicate 95% confidence interval (CI); n ≥ 160 comets per condition. (B) Representative comet images from (A). (C) Scatter dot plots of the percent DNA in tail upon single-cell alkaline gel electrophoresis performed on LN229 MGMT−/MMR− cells treated with 0.2% DMSO control, 200 μM MTZ (12a), 200 μM TMZ (1a), or 200 μM KL-50 (4a) for 2, 8, or 24 hours. After cell lysis, comet slides were irradiated with 10 Gy before alkaline electrophoresis. Lines indicate median; error bars indicate 95% CI; n ≥ 230 comets per condition. Data from samples treated with 0 Gy are shown in fig. S4, C and D. (D) Representative comet images from (C). (E) Denaturing gel electrophoresis of genomic DNA isolated from LN229 MGMT−/MMR+ cells treated with 0.2% DMSO control, 200 μM KL-50 (4a), 200 μM TMZ (1a), 200 μM KL-85 (4b), or 200 μM MTIC (1b) for 24 hours or with 50 μM MMC or 200 μM CCNU (14) for 2 hours. (F) Denaturing gel electrophoresis of linearized 100 ng pUC19 plasmid DNA treated in vitro with 100 μM cisplatin (36 hours), 100 μM MMS (36 hours), 100 μM of KL-50 (4a), or 12b for 6 to 36 hours. For (E) and (F), bands indicating cross-linked DNA are indicated with arrows. Quantification of bands in (F) is provided in fig. S4E.

