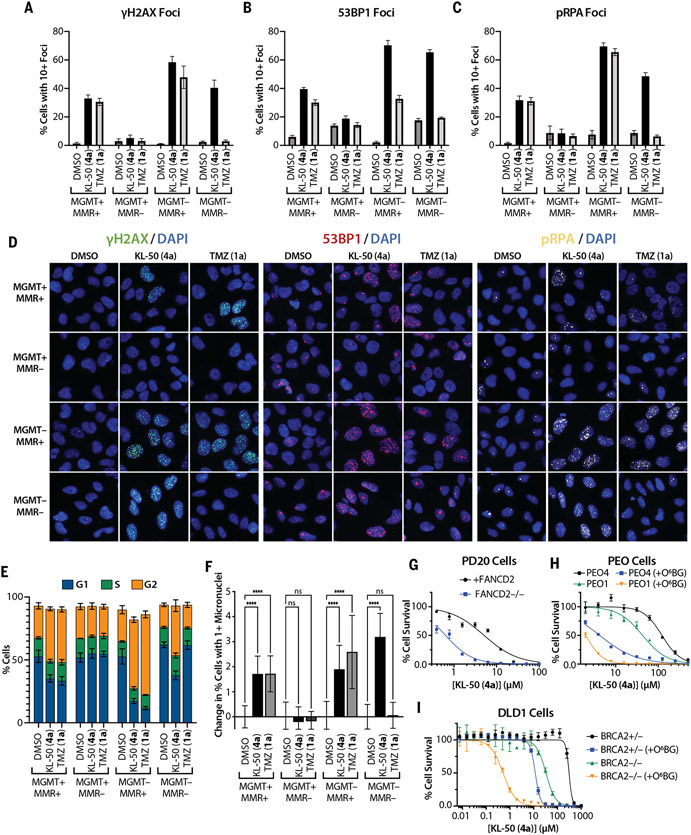
Fig. 4. KL-50 (4a) activates DDR pathways and cycle arrest in MGMT− cells, independent of MMR, and cells deficient in ICL or HR repair are sensitized to KL-50 (4a).
(A) γH2AX, (B) 53BP1, and (C) pRPA foci formation quantified by percent of cells with ≥10 foci in LN229 MGMT+/−, MMR+/− cells treated with 0.1% DMSO control, 20 μM KL-50 (4a), or 20 μM TMZ (1a) for 48 hours. Columns indicate the mean; error bars indicate SD; n > 5 technical replicates. Additional time course data are presented in fig. S6, B to D. (D) Representative foci images of data in (A) to (C). (E) Percentage of cells in G1, S, and G2 cell cycle phases after treatment as in (A) to (C), measured by using integrated nuclear (Hoechst) staining intensity. Columns indicate the mean; error bars indicate SD; n = 3 independent analyses. Additional time course data, cell cycle controls, and representative histograms are presented in fig. S7. (F) Change in percent cells with ≥1 micronuclei from baseline (DMSO control) after treatment as in (A) to (C). Columns indicate the mean; error bars indicate SD; n ≥ 15 technical replicates; ****P < 0.0001; ns, not significant. Additional validation is presented in fig. S9, A and B. (G) Short-term viability assay curves for KL-50 (4a) in PD20 cells, deficient in FANCD2 (FANCD2−/−) or complemented with FANCD2 (+FANCD2). (H) Short-term viability assay curves for KL-50 (4a) in PEO4 (BRCA2+) and PEO1 (BRCA2−/−) cells pretreated with 0.01% DMSO control or 10 mM O6BG (+O6BG) for 1 hour before KL-50 (4a) addition. (I) Short-term viability assay curves for KL-50 (4a) in DLD1 BRCA2+/− and BRCA2−/− cells pretreated with 0.01% DMSO control or 10 mM O6BG (+O6BG) for 1 hour before KL-50 (4a) addition. For (G) to (I), points indicate the mean, and error bars indicate SD; n = 3 technical replicates.

