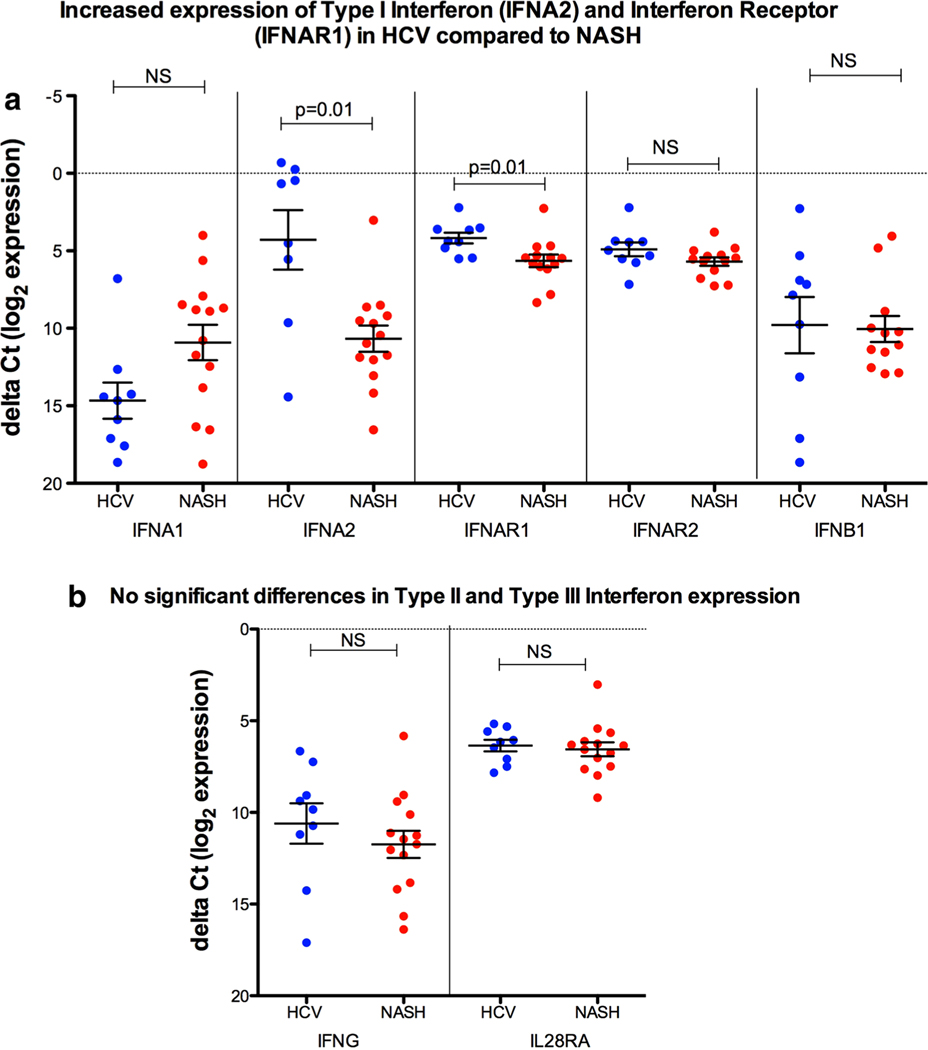
Fig. 1.
a Higher expression of IFNA2, IFNAR1 (type I IFN) in HCV GT3 versus NASH, b while no difference was observed in type II and type III IFNs. Values are mean ± SE of the delta Ct values of the genes; the higher the Ct value of a particular gene in a group of patients, the lower the expression of that gene compared to another group; conversely, a lower Ct value means a higher expression of the gene. p value was calculated by the unpaired t test with Welch’s correction using GraphPad Prism 6.0 software. p values less than 0.05 were considered significant

