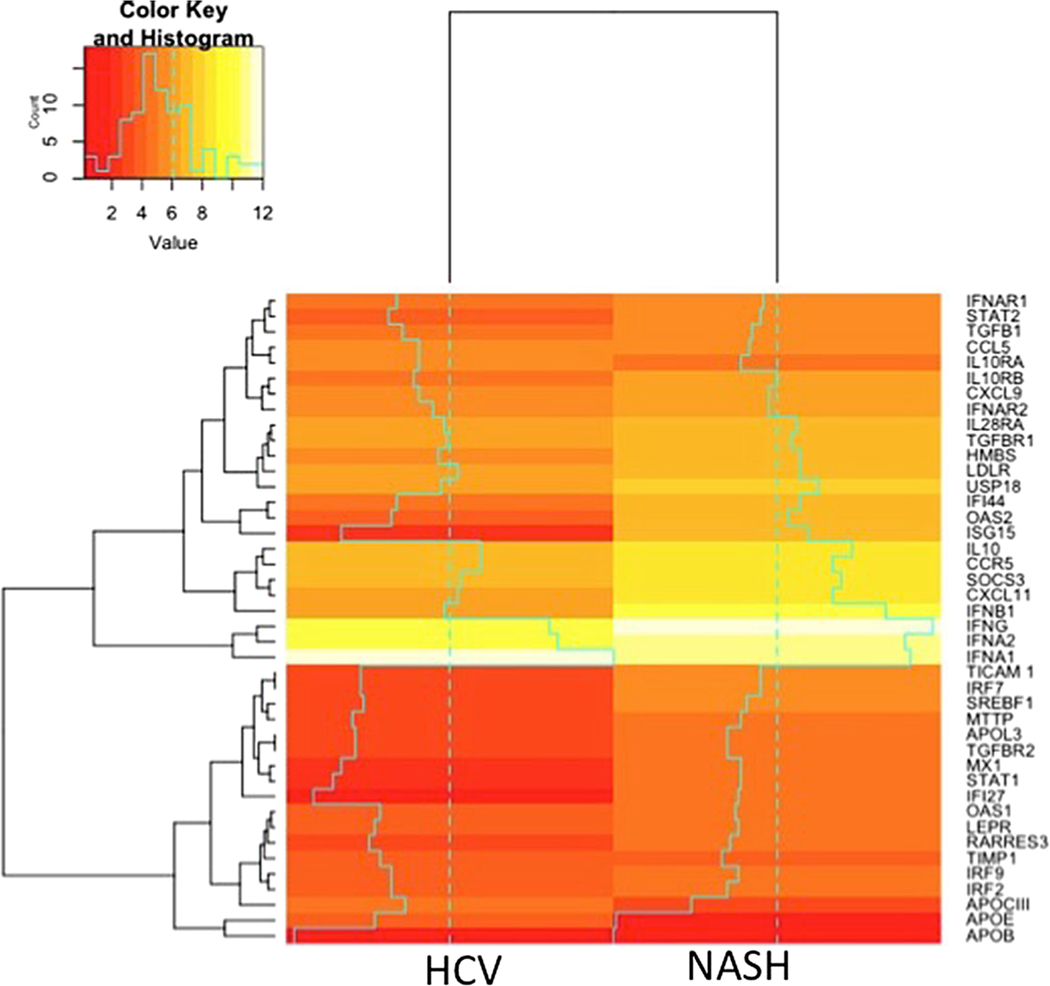
Fig. 5.
Heat map representation of the gene expression in HCV GT-3 infected patients versus NASH. Values are the delta Ct values of the gene in the respective group. Red indicates lower Ct value or higher gene expression and yellow higher Ct values and lower expression of the gene in that group of patients

