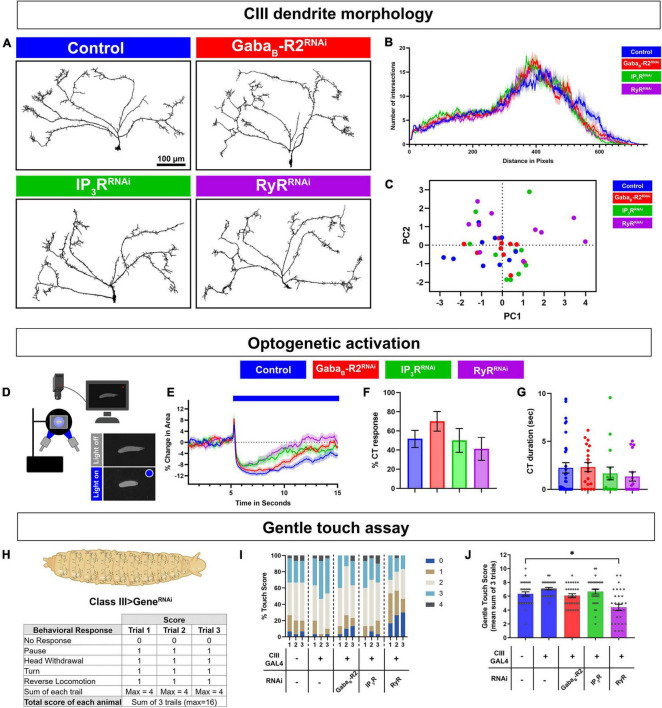
FIGURE 3.
G protein coupled receptor (GPCR) and CICR signaling are not required for CIII neuron dendrite development, general excitability, or neural transmission. (A–C) CIII md neuron dendrite morphometric analyses of cell type specific knockdown of GABAB-R2, IP3R, or RyR. CIII md neurons were visualized using nompCGAL4 > GFP. (A) Representative images of CIII md neuron (ddaF) dendrites with either GABAB-R2, IP3R, or RyR knockdown compared to control (LucRNAi). Scale bar = 100 μ m. (B) Sholl analysis of CIII md neuron dendrites, where numbers of intersections are plotted as a function of distance from the soma. (C) Principal components analysis of multiple morphometric parameters including total terminal branches, total dendritic length, branch density, max number of Sholl intersections and distance at which the max intersections occur in Sholl analyses. NAverage = 10. (D–G) Neural activation of CIII md neurons using optogenetic actuator (ChETA) with cell type specific gene knockdown of GABAB-R2, IP3R, or RyR. Genotype: 19–12 > ChETA + gene-specific RNAi. (D) Schematic of optogenetic stimulation apparatus. (E) Plot of change in area over time for GABAB-R2, IP3R, or RyR knockdown compared to control (LucRNAi). Blue bar represents 10 s of blue light exposure resulting in neural activation of CIII md neurons. (F) Optogenetic CIII md neuron activation evoked %CT response of GABAB-R2, IP3R, or RyR knockdown compared to control. (G) CT duration in seconds for GABAB-R2, IP3R, or RyR knockdown compared to control. (E–G) NAverage = 20. Statistics: %CT response: Fisher’s exact with Benjamini-Hochberg for multiple comparison. CT duration: One-way ANOVA with Holm-Šídák’s for multiple comparisons. (H–J) Drosophila larval responses to innocuous mechanical stimulation. (H) Gentle touch assay scoring schematic. Each behavioral response receives one point and no points, if there was no response, for a maximum of four points per trial. (I) Proportion of each score per trial for each genotype. (J) Average total touch scores for each larva per genotype. NAverage = 30. Statistics: Kruskal–Wallis with Benjamini, Krieger, and Yekutieli for multiple comparisons. Significant differences indicated via asterisks, where *p < 0.05. Created with BioRender.com.

