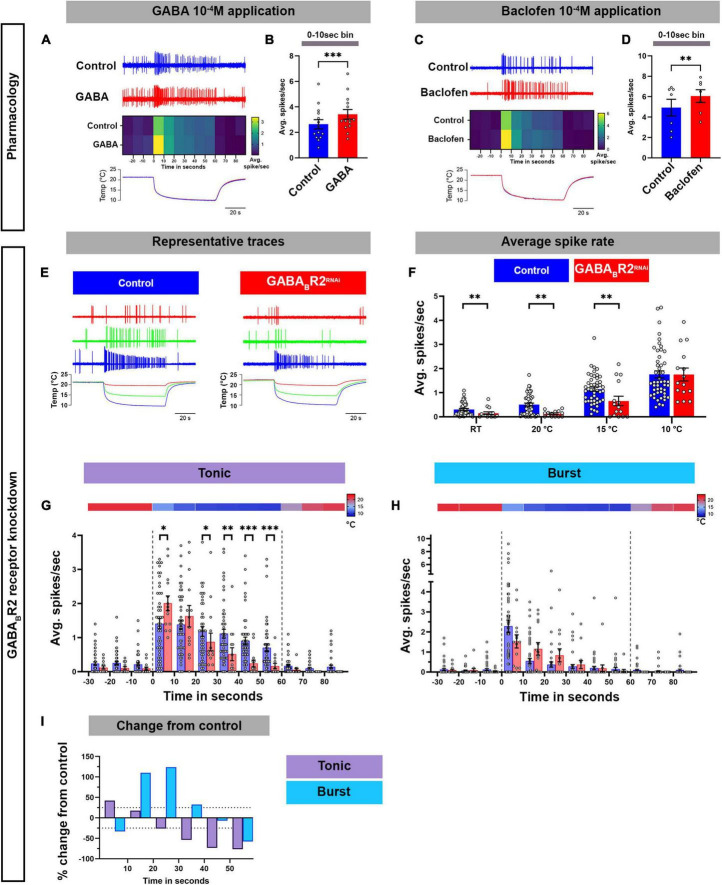
FIGURE 5.
GABAB-R2 receptor is required for proper composition of cold-evoked tonic and bursting pattern in CIII md neurons. (A–D) Assessing cold-evoked electrical responses of CIII md neurons upon (A,B) GABA or (C,D) baclofen application. (A,C) Representative traces of extracellular recordings of CIII md neuron upon cold exposure and (A) GABA 10–4 M or (C) baclofen 10–4 M application. The heatmap represents average spike rate (spikes/second) in 10 s bins. Below, line graph shows real time temperature (10°C) exposure regime of Drosophila larval filet. (B,D) Average spike rate during the first 10 s of stimulus delivery. GABA application: NAverage = 14. Baclofen application: NAverage = 7. Statistics: Paired t-test. (E–I) Electrical responses of CIII md neurons with GABAB-R2 knockdown. (E) Representative physiological firing traces of CIII md neurons with GABAB-R2 knockdown compared to controls during each stimulus temperature (20, 15, and 10°C) and below shows real time temperature exposure regimes of Drosophila larval filet. (F) Average spikes/seconds of CIII md neurons at room temperature (RT) or cold stimulations (20, 15, and 10°C). NAverage = 32. Statistics: Multiple Mann–Whitney test with Benjamini, Krieger, and Yekutieli for multiple comparisons. (G,H) 10°C stimulus evoked tonic spike rate (G) and bursting spike rate (H). Individual spikes are considered to bursts, if inter spike interval is less than 0.15 s for at least three spikes and rest of the spikes counted as tonic spikes. Heatmap above each graph represents stimulus temperature. Spike rate is calculated in 10 s bins. Statistics: Multiple Mann–Whitney tests with Benjamini, Krieger, and Yekutieli for multiple comparisons. (I) Percent change from control for bursting or tonic firing in GABAB-R2 knockdown. Significant differences indicated via asterisks, where *p < 0.05, **p < 0.01, and ***p < 0.001.

