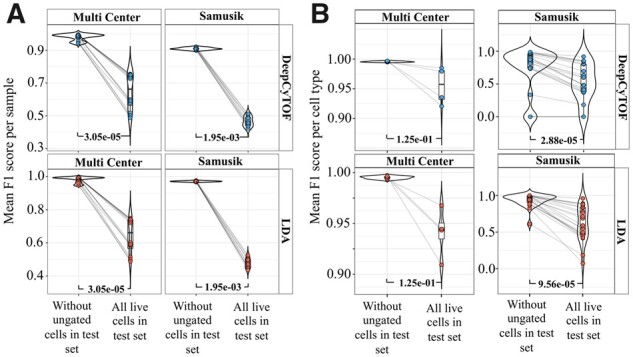
Fig. 3.

(A) Comparison of per sample F1 score without ungated live cells versus with ungated live cells in the test set after applying DeepCyTOF and LDA to two datasets (Multi Center and Samusik). For estimating F1 score for all live cells, TP ungated cells were excluded (see Supplementary Methods). (B) Mean F1 score comparison for each gated cell type (using DeepCyTOF and LDA), with and without including ungated live cells in the test set. (see Supplementary Text, Supplementary Sections S5 and S6). P-values were calculated using paired Wilcoxon Rank Sum test
