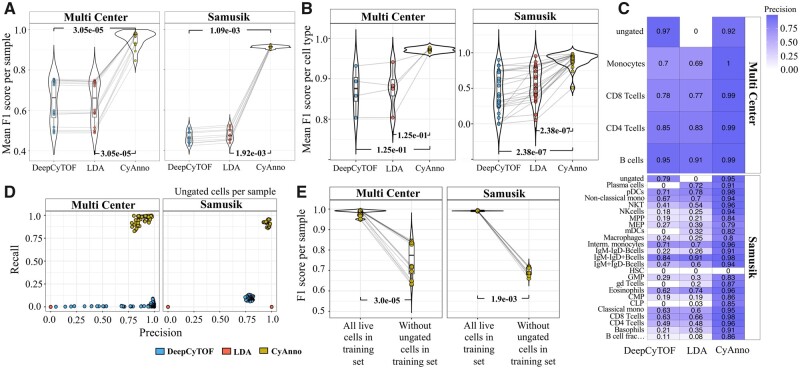
Fig. 5.
Results evaluation with three methods. (A) Mean F1 score comparison (all live cells per sample in test set) with different cell annotation methods tested across two datasets. Mean F1 represents the average of the F1 scores per sample after five iterations of variable training sets. See Supplementary Text, Supplementary Section S5. (B) Comparison of mean F1 score for each cell type in a given dataset predicted with different methods. (C) The heatmap of precision of prediction associated with each cell type. The HSC cell type (in Samusik dataset) was found to have very small cell count (<10) in the training set and, thus, was not used in CyAnno for model training. (D) Precision-versus-recall rate estimated for ungated cells using three different methods. Recall rate for ungated cells with CyAnno were significantly higher than for the other two methods. (E) Pairwise sample F1 score comparison of CyAnno when ungated cells were included (all live cells) in model training versus when they were excluded from model training (without ungated cells). P-values reflect the statistical significance of difference in outcome when ungated cells were not considered for model training. P-values were computed with paired Wilcoxon Rank Sum test

