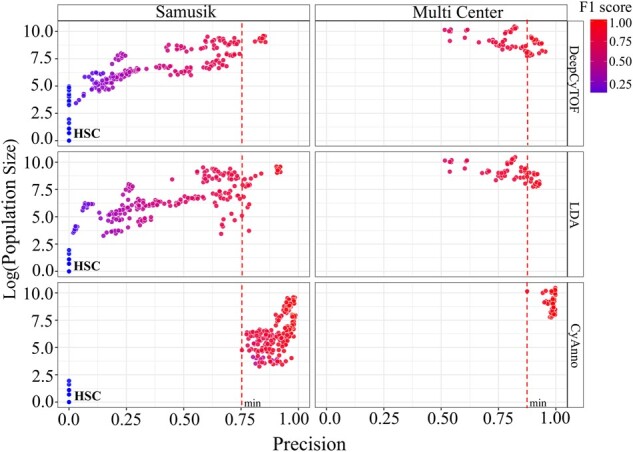
Fig. 6.

The precision scores (X-axis) are plotted with gated cell population size (Y-axis; % live cells) of the given cell type in all the samples of the given dataset. Here, the precision score for each cell type was computed using three different methods, each executed five times, with varying and independent training dataset in each run. Each circle represents the predicted precision score for a cell type per sample in one run, colored by the F1 score for that gated cell type during the respective run. The cell type HSC had a very small cell count (<10 cells) in the overall training set, which did not provide sufficient information for its training, and was thus not included in the training set. The red line marks the minimum precision score observed with CyAnno for the Samusik (0.75; HSC excluded) and Multi Center (0.87) datasets
